Where are we today?
Last | Up-Min | Min | Max | Down Max | Relative Strength | ||
|---|---|---|---|---|---|---|---|
Gold | 2622.4 | 78.2% | 1471.4 | 2786.9 | -5.9% | 87% | On date |
HUI | 280.0 | 71.0% | 163.7 | 363.9 | -23.0% | 58% | Dec 20, 2024 |
HUI/Gold graph
 |
| HUI Gold Miners index relative to the Gold Price in USD.Daily observations over 52 weeks |
 | ||
|
The silver mining index has been the first to break above parity, despite silver lagging gold since we started over 10 years ago. Silver miners recovered from their winter 2021/22 downturn and have been hopping 'above parity' and sliding back below several times before breaking out.
 |
| GMP list based (and capitalization weighed) gold (yellow dots), silver (blue) and equal weight (red) miners indices. Reference 1000 on Nov 19, 2010 (click to enlarge) |
 |
| GMP Miners sorted by loss to gain since inception on Nov 19, 2010. Note that the top miners are left out to avoid excessive scale expansion Click to enlarge |
 |
| GMP elite miners, sorted by gain since starting observations in Nov 2010 (logarithmic view with ticks 100% apart. These miners have more than doubled; click to enlarge |
The contributor driven explorer and (junior) mining spreadsheet
Related blog articles
Several more detailed articles focusing on the longer term have been published. These are using the same approach as this blog page and still are a good read to grasp the historic perspective:- Miners relative to precious metals: a tactical approach; (July 2, 2012)
- Miners relative to precious metals: An update on 2012; (Jan 13, 2013)
- Anatomy of a gold miner bear market (Dec 30, 2013)
- Three year slide of precious metal miners (Dec 31, 2014)
- Gold miner bear market starting its fifth year (Jan 3, 2016)
- Precious metal miners relative to metal prices (Dec 31, 2016)
- Precious metal mining in 2018: a dark cloud with a silver lining and 2019 outlook (29 Dec 2018)
- Gold Miner Pulse 2019 (half-year update) (Jul 1, 2019)
- Precious metal and miner 2019 overview and outlook for 2020. (Dec 31, 2019)
- Gold Miner Pulse - Friday March 13 (Mar 13, 2020)
- Gold Miner Pulse - October 2020 update (Oct 10, 2020)
Where are we today?
Last | Up_Min | Min | Max | Down_max | Relative Strength | ||
Gold | 2062.2 | 40.2% | 1,270.4 | 2,077.2 | -0.7% | 98% | on date: |
HUI | 243.3 | 48.6% | 147.6 | 363.9 | -33.1% | 40% | 12/29/2023 |
HUI/Gold graph
 |
| HUI index relative to Gold over the last 6 months; the short (blue) moving average is over 50 days while the long moving average (red) is over 200 days, click to enlarge |
 |
| HUI index relative to Gold over the last 12 months; the short (blue) moving average is over 50 days while the long moving average (red) is over 200 days, click to enlarge |
 |
| HUI index relative to Gold: weekly observations over the last 3 years leading into Dec 2023. The blue moving average line is over 26 weeks while the red moving average is over two years, click to enlarge |
SIL/Silver graph
 |
Global-X Silver Miners ETF, SIL relative to silver bullion; Daily observations over 6 months. Click to enlarge |
 |
Global-X Silver Miners ETF, SIL relative to silver bullion; Daily observations over 12 months. Click to enlarge |
 |
Global-X Silver Miners ETF, SIL relative to silver bullion; Weekly observations over 3 years. Click to enlarge |
The silver mining index was the first to break above parity, despite silver about flat from where we started over 10 years ago. After the June top, a lengthy slide brought the silver index back to 800. Ultimately the Christmas rally brought us back to 1000.
 |
| GMP list based (and capitalization weighed) gold (yellow dots), silver (blue) and equal weight (red) miners indices. Reference 1000 on Nov 19, 2010 (click to enlarge) |
 |
| Long term graph of the GMP list based (and capitalisation weighed) gold (black), silver (blue) and equal weight (red) miners indices. Reference 1000 on Nov 19, 2010. - Data till Dec 29, 2017 (click to enlarge) |
The silver miners index rose till 1400 in April 2011, peaking three weeks earlier than did the silver price. The silver miners index also posted a higher maximum during both the March 2014 and June to early August recovery than it did in the August 2013 recovery. The gold miners index and the equal weight index did not peak higher at any of the failing 2014-15 recoveries than they did in August 2013. By January 2016 silver miners nearly completely lost their edge relative to gold miners, yet the recovery proved more vigorous. The below long term graph covers over three years: the end of the bear market with miners bottoming by Dec 2015, the 2016 boom-bust over the tedious months early 2018, with miners unable to match gold strengthening. Miner quotes were jittery after gold plunged below $1200. Towards end 2018 gold strengthened to $1280 with miners recovering timidly. As gold broke above its trading range late spring 2019, miners started rallying. The 2016 miners boom euphoria didn't however repeat. The 2020 miners surge was driven by a substantial rise of precious metals with gold setting a new ATH above $2060 in August.
 |
| Continuation of the long term graph from 2017 till the end of 2020. |
 |
| Mid term graph of the GMP list based indexes from Jan 2020 till end Dec 2023 |
There is an important performance disparity among the gold and silver miners of the GMP database. Several laggards seem moribund. The median (or middle) miner (with an equal number better and worse) is now losing 57.17%: more than a double is needed to break even. The average emerged from the red now posting a 4.13% gain. The performance distribution is slanted towards the few high gains.
 |
| GMP Miners sorted by loss to gain since inception on Nov 19, 2010. Note that the top miners are left out to avoid excessive scale expansion Click to enlarge |
 |
| GMP elite miners, sorted by gain since starting observations in Nov 2010 (logarithmic view with ticks 10% apart in the first decade and 100% in the top decade). Click to enlarge |
The contributor driven explorer and (junior) mining spreadsheet
Scope: This extended blog page is monitoring whether trends are persisting and/or how they are evolving. Therefore the graphs posted here are showing both daily observations with a 6 months time horizon and some graphs with a 3 to 4 year time horizon. For the very long term reference frame, see the articles referenced at the bottom.
Where are we today?
Last | Up_Min | Min | Max | Down_max | Relative Strength | ||
Gold | 1919.8 | 30.5% | 1,270.4 | 2,063.2 | -7.0% | 76% | on date: |
HUI | 233.9 | 42.9% | 147.6 | 363.9 | -35.7% | 35% | 6/30/2023 |
HUI/Gold graph
 |
| HUI index relative to Gold over the last 6 months, click to enlarge |
 |
| HUI index relative to Gold over the last 12 months, click to enlarge |
And since:
Longer term graph
 |
| HUI index relative to Gold: weekly observations over the last 3 years leading into June 2023, click to enlarge |
SIL/Silver graph
 |
| Global-X Silver Miners ETF, SIL relative to silver bullion; Daily observations over 6 months. Click to enlarge |
 |
| Global-X Silver Miners ETF, SIL relative to silver bullion; Daily observations over 12 months. Click to enlarge |
 |
| Global-X Silver Miners ETF, SIL relative to silver bullion; Weekly observations over 3 years. Click to enlarge |
Over the complete observation period, silver is up from $18/Oz to $22.76/oz, though a peak to $30/Oz was reached early on in the graph. Miners were not impressed: we notice a long term downtrend, though on the shorter graphs it seems a slide in slices.
The silver mining index was the first to break above parity, despite silver about flat from where we started over 10 years ago. It only just now broke back above 1000 after a slump from February with a double dip around Feb 24 and March 9.
 |
| GMP list based (and capitalization weighed) gold (yellow dots), silver (blue) and equal weight (red) miners indices. Reference 1000 on Nov 19, 2010 (click to enlarge) |
|
| Long term graph of the GMP list based (and capitalisation weighed) gold (black), silver (blue) and equal weight (red) miners indices. Reference 1000 on Nov 19, 2010. - Data till Dec 29, 2017 (click to enlarge) |
The silver miners index rose till 1400 in April 2011, peaking three weeks earlier than did the silver price. The silver miners index also posted a higher maximum during both the March 2014 and June to early August recovery than it did in the August 2013 recovery. The gold miners index and the equal weight index did not peak higher at any of the failing 2014-15 recoveries than they did in August 2013. By January 2016 silver miners nearly completely lost their edge relative to gold miners, yet the recovery proved more vigorous. The below long term graph covers over three years: the end of the bear market with miners bottoming by Dec 2015, the 2016 boom-bust over the tedious months early 2018, with miners unable to match gold strengthening. Miner quotes were jittery after gold plunged below $1200. Towards end 2018 gold strengthened to $1280 with miners recovering timidly. As gold broke above its trading range late spring 2019, miners started rallying. The 2016 miners boom euphoria didn't however repeat. The 2020 miners surge was driven by a substantial rise of precious metals with gold setting a new ATH above $2060 in August.
|
| Continuation of the long term graph from 2017 till the end of 2020. |
 |
| Mid term graph of the GMP list based indexes from Jan 2020 till end June 2023 |
There is an important performance disparity among the gold and silver miners of the GMP database. Several laggards seem moribund. The median (or middle) miner (with an equal number better and worse) is now losing 53.3%: more than a double is needed to break even. The average emerged from the red now posting a 5.9% gain. The performance distribution is slanted towards the few high gains.
 | |
|
 | |
|
The contributor driven explorer and (junior) mining spreadsheet
Related blog articles
Several more detailed articles focusing on the longer term have been published. These are using the same approach as this blog page and still are a good read to grasp the historic perspective:- Miners relative to precious metals: a tactical approach; (July 2, 2012)
- Miners relative to precious metals: An update on 2012; (Jan 13, 2013)
- Anatomy of a gold miner bear market (Dec 30, 2013)
- Three year slide of precious metal miners (Dec 31, 2014)
- Gold miner bear market starting its fifth year (Jan 3, 2016)
- Precious metal miners relative to metal prices (Dec 31, 2016)
- Precious metal mining in 2018: a dark cloud with a silver lining and 2019 outlook (29 Dec 2018)
- Gold Miner Pulse 2019 (half-year update) (Jul 1, 2019)
- Precious metal and miner 2019 overview and outlook for 2020. (Dec 31, 2019)
- Gold Miner Pulse - Friday March 13 (Mar 13, 2020)
- Gold Miner Pulse - October 2020 update (Oct 10, 2020)
Scope: This extended blog page is monitoring whether trends are persisting and/or how they are evolving. Therefore the graphs posted here are showing both daily observations with a 6 months time horizon and some graphs with a 3 to 4 year time horizon. For the very long term reference frame, see the articles referenced at the bottom.
Where are we today?
Last | Up_Min | Min | Max | Down_max | Relative Strength | ||
Gold | 1969.7 | 33.9% | 1,270.4 | 2,063.2 | -4.5% | 84% | on date: |
HUI | 256.2 | 56.5% | 147.6 | 363.9 | -29.6% | 46% | 3/31/2023 |
HUI/Gold graph
 |
| HUI index relative to Gold over the last 6 months, click to enlarge |
 |
| HUI index relative to Gold over the last 12 months, click to enlarge |
 |
| HUI index relative to Gold: weekly observations over the last 5 years leading to end 2022, click to enlarge |
SIL/Silver graph
 |
| Global-X Silver Miners ETF, SIL relative to silver bullion; Daily observations over 6 months. Click to enlarge |
 | |
|
The silver mining index was the first to break above parity, despite silver about flat from where we started over 10 years ago. It only just now broke back above 1000 after a slump from February with a double dip around Feb 24 and March 9.
 |
| GMP list based (and capitalization weighed) gold (yellow dots), silver (blue) and equal weight (red) miners indices. Reference 1000 on Nov 19, 2010 (click to enlarge) |
|
| Long term graph of the GMP list based (and capitalisation weighed) gold (black), silver (blue) and equal weight (red) miners indices. Reference 1000 on Nov 19, 2010. - Data till Dec 29, 2017 (click to enlarge) |
The silver miners index rose till 1400 in April 2011, peaking three weeks earlier than did the silver price. The silver miners index also posted a higher maximum during both the March 2014 and June to early August recovery than it did in the August 2013 recovery. The gold miners index and the equal weight index did not peak higher at any of the failing 2014-15 recoveries than they did in August 2013. By January 2016 silver miners nearly completely lost their edge relative to gold miners, yet the recovery proved more vigorous. The below long term graph covers over three years: the end of the bear market with miners bottoming by Dec 2015, the 2016 boom-bust over the tedious months early 2018, with miners unable to match gold strengthening. Miner quotes were jittery after gold plunged below $1200. Towards end 2018 gold strengthened to $1280 with miners recovering timidly. As gold broke above its trading range late spring 2019, miners started rallying. The 2016 miners boom euphoria didn't however repeat. The 2020 miners surge was driven by a substantial rise of precious metals with gold setting a new ATH above $2060 in August.
|
| Continuation of the long term graph from 2017 till the end of 2020. |
 |
| Mid term graph of the GMP list based indexes from Jan 2020 till end Jun 2023 |
There is an important performance disparity among the gold and silver miners of the GMP database. Several laggards seem moribund. The median (or middle) miner (with an equal number better and worse) is now losing 54.9%: more than a double is needed to break even. The average emerged from the red now posting a 7.4% gain. The performance distribution is slanted towards the few high gains.
 |
| MP Miners sorted by loss to gain since inception on Nov 19, 2010. Note that the top miners are left out to avoid excessive scale expansion Click to enlarge |
 |
| GMP elite miners, sorted by gain since starting observations in Nov 2010 (logarithmic view with ticks 100% apart) Click to enlarge |
The contributor driven explorer and (junior) mining spreadsheet
Archived GMP page with graphs last updated on Dec 30, 2022
Scope: This extended blog page is monitoring whether trends are persisting and/or how they are evolving. Therefore the graphs posted here are showing both daily observations with a 6 months time horizon and some graphs with a 3 to 4 year time horizon. For the very long term reference frame, see the articles referenced at the bottom.
Where are we today?
|
Last |
Up_Min |
Min |
Max |
Down_max |
Relative Strength |
||
|
Gold |
1824.5 |
24.0% |
1,270.4 |
2,063.2 |
-11.6% |
60% |
on date: |
|
HUI |
229.7 |
40.4% |
147.6 |
363.9 |
-36.9% |
33% |
12/30/2022 |
HUI/Gold graph
 |
| HUI index relative to Gold over the last 6 months, click to enlarge |
 |
| HUI index relative to Gold over the last 12 months, click to enlarge |
|
| HUI index relative to Gold: weekly observations over the last 5 years, click to enlarge |
SIL/Silver graph
 |
| Global-X Silver Miners ETF, SIL relative to silver bullion; Daily observations over 6 months. Click to enlarge |
 |
| Global-X Silver Miners ETF, SIL relative to silver bullion; Daily observations over 12 months. Click to enlarge |
The silver mining index was the first to break above parity, despite silver about flat from where we started over 10 years ago.
 |
| GMP list based (and capitalization weighed) gold (yellow dots), silver (blue) and equal weight (red) miners indices. Reference 1000 on Nov 19, 2010 (click to enlarge) |
|
| Long term graph of the GMP list based (and capitalisation weighed) gold (black), silver (blue) and equal weight (red) miners indices. Reference 1000 on Nov 19, 2010. - Data till Dec 29, 2017 (click to enlarge) |
The silver miners index rose till 1400 in April 2011, peaking three weeks earlier than did the silver price. The silver miners index also posted a higher maximum during both the March 2014 and June to early August recovery than it did in the August 2013 recovery. The gold miners index and the equal weight index did not peak higher at any of the failing 2014-15 recoveries than they did in August 2013. By January 2016 silver miners nearly completely lost their edge relative to gold miners, yet the recovery proved more vigorous. The below long term graph covers over three years: the end of the bear market with miners bottoming by Dec 2015, the 2016 boom-bust over the tedious months early 2018, with miners unable to match gold strengthening. Miner quotes were jittery after gold plunged below $1200. Towards end 2018 gold strengthened to $1280 with miners recovering timidly. As gold broke above its trading range late spring 2019, miners started rallying. The 2016 miners boom euphoria didn't however repeat. The 2020 miners surge was driven by a substantial rise of precious metals with gold setting a new ATH above $2060 in August.
|
| Continuation of the long term graph from 2017 till the end of 2020. |
 |
| Mid term graph of the GMP list based indexes from summer 2019 till end Dec 2022 |
There is an important performance disparity among the gold and silver miners of the GMP database. Several laggards seem moribund. The median (or middle) miner (with an equal number better and worse) is now losing 64.2%: almost a triple is needed to break even. The average has slid into the red for a couple of months now still posting a 2.1% loss. The performance distribution is slanted towards the few high gains.
 |
| GMP Miners sorted by loss to gain since inception on Nov 19, 2010. Note that the top miners are left out to avoid excessive scale expansion Click to enlarge |
 |
| GMP elite miners, sorted by gain since starting observations in Nov 2010 (logarithmic view with ticks 100% apart) Click to enlarge |
The contributor driven explorer and (junior) mining spreadsheet
Related blog articles
Several more detailed articles focusing on the longer term have been published. These are using the same approach as this blog page and still are a good read to grasp the historic perspective:- Miners relative to precious metals: a tactical approach; (July 2, 2012)
- Miners relative to precious metals: An update on 2012; (Jan 13, 2013)
- Anatomy of a gold miner bear market (Dec 30, 2013)
- Three year slide of precious metal miners (Dec 31, 2014)
- Gold miner bear market starting its fifth year (Jan 3, 2016)
- Precious metal miners relative to metal prices (Dec 31, 2016)
- Precious metal mining in 2018: a dark cloud with a silver lining and 2019 outlook (29 Dec 2018)
- Gold Miner Pulse 2019 (half-year update) (Jul 1, 2019)
- Precious metal and miner 2019 overview and outlook for 2020. (Dec 31, 2019)
- Gold Miner Pulse - Friday March 13 (Mar 13, 2020)
- Gold Miner Pulse - October 2020 update (Oct 10, 2020)
Scope: This extended blog page is monitoring whether trends are persisting and/or how they are evolving. Therefore the graphs posted here are showing both daily observations with a 6 months time horizon and some graphs with a 3 to 4 year time horizon. For the very long term reference frame, see the articles referenced at the bottom.
Where are we today?
|
Last |
Up_Min |
Min |
Max |
Down_max |
Relative Strength |
||
|
Gold |
1826.4 |
24.1% |
1,270.4 |
2,063.2 |
-11.5% |
60% |
on date: |
|
HUI |
238.0 |
45.4% |
147.6 |
363.9 |
-34.6% |
37% |
6/24/2022 |
HUI/Gold graph
 |
| HUI index relative to Gold over the last 6 months, click to enlarge |
 |
| HUI index relative to Gold over the last 12 months, click to enlarge |
 |
| HUI index relative to Gold: weekly observations over the last 5 years, click to enlarge |
SIL/Silver graph
 |
| Global-X Silver Miners ETF, SIL relative to silver bullion; Daily observations over 6 months. Click to enlarge |
 |
| Global-X Silver Miners ETF, SIL relative to silver bullion; Daily observations over 12 months. Click to enlarge |
Similar to the valuation graph for gold miners, below you find a weekly graph. The blue moving average line is over one year (52 weeks) while the red long term moving average is over 3 years.
 |
| Global-X Silver Miners ETF, SIL relative to silver bullion; Weekly observations over 5 years. Click to enlarge |
The silver mining index was the first to break above parity, despite silver about flat from where we started over 10 years ago.
 |
| GMP list based (and capitalization weighed) gold (yellow dots), silver (blue) and equal weight (red) miners indices. Reference 1000 on Nov 19, 2010 (click to enlarge) |
Note that the index calculation always is compensated for composition changes.
|
| Long term graph of the GMP list based (and capitalisation weighed) gold (black), silver (blue) and equal weight (red) miners indices. Reference 1000 on Nov 19, 2010. - Data till Dec 29, 2017 (click to enlarge) |
The silver miners index rose till 1400 in April 2011, peaking three weeks earlier than did the silver price. The silver miners index also posted a higher maximum during both the March 2014 and June to early August recovery than it did in the August 2013 recovery. The gold miners index and the equal weight index did not peak higher at any of the failing 2014-15 recoveries than they did in August 2013. By January 2016 silver miners nearly completely lost their edge relative to gold miners, yet the recovery proved more vigorous. The below long term graph covers over three years: the end of the bear market with miners bottoming by Dec 2015, the 2016 boom-bust over the tedious months early 2018, with miners unable to match gold strengthening. Miner quotes were jittery after gold plunged below $1200. Towards end 2018 gold strengthened to $1280 with miners recovering timidly. As gold broke above its trading range late spring 2019, miners started rallying. The 2016 miners boom euphoria didn't however repeat. The 2020 miners surge was driven by a substantial rise of precious metals with gold setting a new ATH above $2060 in August.
|
| Continuation of the long term graph from 2017 till the end of 2020. |
 |
| Mid/Long term graph of the GMP list based (and capitalization weighed) gold (black), silver (blue) and equal weight (red) miners indices. Reference 1000 on Nov 19, 2010. - Data till Jun 24, 2022 (click to enlarge) |
There still is an important performance disparity among the gold and silver miners of the GMP database. Several laggards seem moribund. The median (or middle) miner (with an equal number better and worse) is now losing 62.9%: well over a double is needed before breaking even. The average has slid into the red for a couple of months now posting a 12.4% loss. The performance distribution is slanted towards the few high gains.
 |
| GMP Miners sorted by loss to gain since inception on Nov 19, 2010. Note that the top miners are left out to avoid excessive scale expansion Click to enlarge |
 | |
|
The contributor driven explorer and (junior) mining spreadsheet
Related blog articles
Several more detailed articles focusing on the longer term have been published. These are using the same approach as this blog page and still are a good read to grasp the historic perspective:- Miners relative to precious metals: a tactical approach; (July 2, 2012)
- Miners relative to precious metals: An update on 2012; (Jan 13, 2013)
- Anatomy of a gold miner bear market (Dec 30, 2013)
- Three year slide of precious metal miners (Dec 31, 2014)
- Gold miner bear market starting its fifth year (Jan 3, 2016)
- Precious metal miners relative to metal prices (Dec 31, 2016)
- Precious metal mining in 2018: a dark cloud with a silver lining and 2019 outlook (29 Dec 2018)
- Gold Miner Pulse 2019 (half-year update) (Jul 1, 2019)
- Precious metal and miner 2019 overview and outlook for 2020. (Dec 31, 2019)
- Gold Miner Pulse - Friday March 13 (Mar 13, 2020)
- Gold Miner Pulse - October 2020 update (Oct 10, 2020)
Scope: This extended blog page is monitoring whether trends are persisting and/or how they are evolving. Therefore the graphs posted here are showing both daily observations with a 6 months time horizon and some graphs with a 3 to 4 year time horizon. For the very long term reference frame, see the articles referenced at the bottom.
Where are we today?
|
Last |
Up_Min |
Min |
Max |
Down_max |
Relative Strength |
||
|
Gold |
1798.7 |
22.2% |
1,471.4 |
2,063.2 |
-12.8% |
55% |
on date: |
|
HUI |
247.5 |
51.2% |
147.6 |
363.9 |
-32.0% |
42% |
12/17/2021 |
HUI/Gold graph
 |
| HUI index relative to Gold over the last 6 months, click to enlarge |
 |
| HUI index relative to Gold year-to-date, click to enlarge |
SIL/Silver graph
 |
| Global-X Silver Miners ETF, SIL relative to silver bullion; Daily observations over 6 months. Click to enlarge |
 |
Global-X Silver Miners ETF, SIL relative to silver bullion; Daily observations year-to-date. Click to enlarge |
The silver mining index was the first to break above parity, despite silver about flat from where we started over 10 years ago.
 | |
|
|
| Long term graph of the GMP list based (and capitalisation weighed) gold (black), silver (blue) and equal weight (red) miners indices. Reference 1000 on Nov 19, 2010. - Data till Dec 29, 2017 (click to enlarge) |
The silver miners index rose till 1400 in April 2011, peaking three weeks earlier than did the silver price. The silver miners index also posted a higher maximum during both the March 2014 and June to early August recovery than it did in the August 2013 recovery. The gold miners index and the equal weight index did not peak higher at any of the failing 2014-15 recoveries than they did in August 2013. By January 2016 silver miners nearly completely lost their edge relative to gold miners, yet the recovery proved more vigorous. The below long term graph covers over three years: the end of the bear market with miners bottoming by Dec 2015, the 2016 boom-bust over the tedious months early 2018, with miners unable to match gold strengthening. Miner quotes were jittery after gold plunged below $1200. Towards end 2018 gold strengthened to $1280 with miners recovering timidly. As gold broke above its trading range late spring 2019, miners started rallying. The 2016 miners boom euphoria didn't however repeat. The 2020 miners surge was driven by a substantial rise of precious metals with gold setting a new ATH above $2060 in August.
 |
| Mid/Long term graph of the GMP list based (and capitalisation weighed) gold (black), silver (blue) and equal weight (red) miners indices. Reference 1000 on Nov 19, 2010. - Data till Dec 17, 2021 (click to enlarge) |
There is an important performance disparity among the gold and silver miners of the GMP database. Several laggards seem moribund. The median (or middle) miner (with an equal number better and worse) is losing 41.0%: still well below break even. The average is posting a 8.5% profit. The performance distribution is slanted towards the high gains.
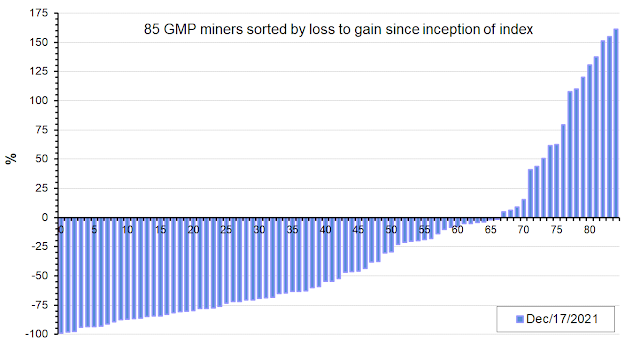 |
| GMP Miners sorted by loss to gain since inception on Nov 19, 2010. Note that the top miners are left out to avoid excessive scale expansion Click to enlarge |
 | |
|
The contributor driven explorer and (junior) mining spreadsheet
Related blog articles
Several more detailed articles focusing on the longer term have been published. These are using the same approach as this blog page and still are a good read to grasp the historic perspective:- Miners relative to precious metals: a tactical approach; (July 2, 2012)
- Miners relative to precious metals: An update on 2012; (Jan 13, 2013)
- Anatomy of a gold miner bear market (Dec 30, 2013)
- Three year slide of precious metal miners (Dec 31, 2014)
- Gold miner bear market starting its fifth year (Jan 3, 2016)
- Precious metal miners relative to metal prices (Dec 31, 2016)
- Precious metal mining in 2018: a dark cloud with a silver lining and 2019 outlook (29 Dec 2018)
- Gold Miner Pulse 2019 (half-year update) (Jul 1, 2019)
- Precious metal and miner 2019 overview and outlook for 2020. (Dec 31, 2019)
- Gold Miner Pulse - Friday March 13 (Mar 13, 2020)
- Gold Miner Pulse - October 2020 update (Oct 10, 2020)
This extended version includes long term data. It is not going to be updated regularly.
The blog page is monitoring whether trends are persisting. Therefore the graphs posted here are showing daily observations year-to-date or with a 6 months time horizon. For the long term reference frame, see the articles referenced at the bottom.
Where are we today?
|
Last |
Up_Min |
Min |
Max |
Down_max |
Relative Strength |
||
|
Gold |
1877.8 |
47.8% |
1,270.4 |
2,063.2 |
-9.0% |
77% |
on date: |
|
HUI |
307.4 |
108.3% |
147.6 |
363.9 |
-15.5% |
74% |
06/11/2021 |
HUI/Gold graph
 |
| HUI index relative to Gold over the last 6 months, click to enlarge |
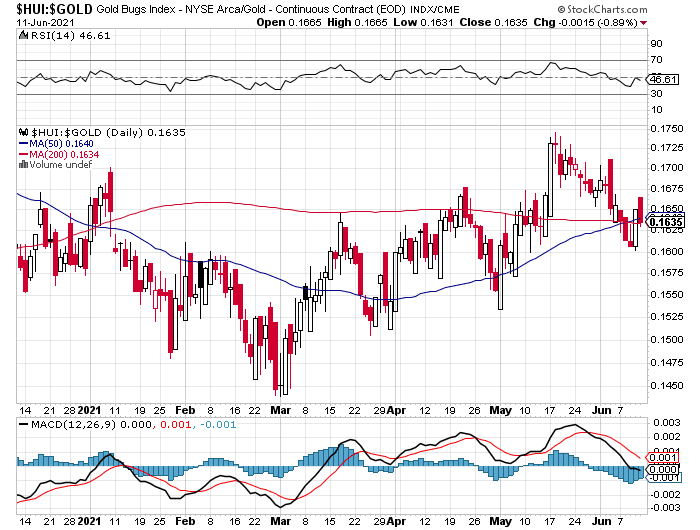
HUI/Gold ended 2019 on a high, but gold rising because of political tension upon the elimination of Qassem Suleimani did not inspire miners. HUI/Gold slid to and broke below its 50 dma. The Vancouver Resource Investment Conference didn't inspire any recovery either. The yellow metal convincingly breaking above $1600 curbed the trend but the Corona virus frenzy slashed miners and precious metals. HUI/Gold plunged both beneath the 50 dma and the 200 dma. The surprise 50 bp FED rate cut launched gold higher again with miners briefly bouncing despite a tepid stock market response.
SIL/Silver graph
 |
| Global-X Silver Miners ETF, SIL relative to silver bullion; Daily observations over 6 months. Click to enlarge |
Previous longer term review has been posted end December 2019: Precious metal and miner 2019 overview and outlook for 2020.
SIL/silver peaked on Dec 30, 2019. Silver miners retreated with the broad market, despite metals firming 'for the wrong reason' (violence in Iraq and political tension). SIL/silver slid below its 50 dma. Investors are disappointed that silver again lagging gold, with the Au/Ag ratio again in excess of 86. The Vancouver Resource Investment Conference didn't lead to any recovery either. Silver regaining $18 brought some improvement but the Corona virus frenzy slashed both miners and precious metals.
Who was to predict silver to slide from $18.60 to $11.65 on less than four weeks time? The abrupt slide aggravated after mid March. Silver miners imploded, reaching bear market valuation as is shown on the new graph. However as silver plunged beneath $12, miners shrugged off the extreme bearish stance and recovered with the general bear market bounce.
After extremely volatile swings, the SIL:$Silver ratio entered into an uptrend. This is illustrating the remarkable silver miner resilience.
The metal ultimately rallied, regaining its loss incurred during the Corona frenzy sell-off. Nevertheless, the silver miner rally started losing steam. After precious metals again weakened early June, SIL/Silver slid beneath its rising 50 dma.
The silver mining index was the first to break above parity, despite silver about flat from where we started over 10 years ago.
 |
| GMP list based (and capitalization weighed) gold (yellow dots), silver (blue) and equal weight (red) miners indices. Reference 1000 on Nov 19, 2010 (click to enlarge) |
|
| Long term graph of the GMP list based (and capitalisation weighed) gold (black), silver (blue) and equal weight (red) miners indices. Reference 1000 on Nov 19, 2010. - Data till Dec 29, 2017 (click to enlarge) |
The silver miners index rose till 1400 in April 2011, peaking three weeks earlier than did the silver price. The silver miners index also posted a higher maximum during both the March 2014 and June to early August recovery than it did in the August 2013 recovery. The gold miners index and the equal weight index did not peak higher at any of the failing 2014-15 recoveries than they did in August 2013. By January 2016 silver miners nearly completely lost their edge relative to gold miners, yet the recovery proved more vigorous. The below long term graph covers over three years: the end of the bear market with miners bottoming by Dec 2015, the 2016 boom-bust over the tedious months early 2018, with miners unable to match gold strengthening. Miner quotes were jittery after gold plunged below $1200. Towards end 2018 gold strengthened to $1280 with miners recovering timidly. As gold broke above its trading range late spring 2019, miners started rallying. The 2016 miners boom euphoria didn't however repeat. The 2020 miners surge was driven by a substantial rise of precious metals with gold setting a new ATH above $2060 in August.
 |
| Mid/Long term graph of the GMP list based (and capitalisation weighed) gold (black), silver (blue) and equal weight (red) miners indices. Reference 1000 on Nov 19, 2010. - Data till Jan 29, 2021 (click to enlarge) |
There is an important performance disparity among the gold and silver miners of the GMP database. Several laggards seem moribund. The median (or middle) miner (with an equal number better and worse) is losing 21.1%: still well below break even. The average is posting a 24.7% profit. The performance distribution is slanted towards the high gains.
 |
| GMP Miners sorted by loss to gain since inception on Nov 19, 2010. Note that the top miners are left out to avoid excessive scale expansion Click to enlarge |
 |
| GMP elite miners, sorted by gain since starting observations in Nov 2010 using a logarithmic view with ticks 100% apart, Click to enlarge |
The contributor driven explorer and (junior) mining spreadsheet
Related blog articles
Several more detailed articles focusing on the longer term have been published. These are using the same approach as this blog page and still are a good read to grasp the historic perspective:- Miners relative to precious metals: a tactical approach; (July 2, 2012)
- Miners relative to precious metals: An update on 2012; (Jan 13, 2013)
- Anatomy of a gold miner bear market (Dec 30, 2013)
- Three year slide of precious metal miners (Dec 31, 2014)
- Gold miner bear market starting its fifth year (Jan 3, 2016)
- Precious metal miners relative to metal prices (Dec 31, 2016)
- Precious metal mining in 2018: a dark cloud with a silver lining and 2019 outlook (29 Dec 2018)
- Gold Miner Pulse 2019 (half-year update) (Jul 1, 2019)
- Precious metal and miner 2019 overview and outlook for 2020. (Dec 31, 2019)
- Gold Miner Pulse - Friday March 13 (Mar 13, 2020)
- Gold Miner Pulse - October 2020 update (Oct 10, 2020)
No comments:
Post a Comment