Short 2018 mining review
Early last year we witnessed gold rallying rapidly to what was to be its 2018 high. Till about mid May, the yellow metal managed to uphold $1300. Miners however have mostly been lagging the advance of gold, with the HUI/Gold ratio in decline and bottoming early September, after gold made its low by mid August.Full year performance of HUI/Gold
 | |
|
 |
| HUI/Gold ratio - Daily observations over the last 6 months (click to enlarge) |
HUI/Gold made a nice inverted head and shoulder pattern from mid Aug to early Oct, which was pinpointed on Sept 29. However enthusiasm proved short lived. In the second week of Oct miners rallied as gold was breaking above $1200 again. However the rally was followed by a sell-off two weeks later, though the yellow metal upheld $1200 until well into November. HUI/Gold then bottomed as gold kept flirting with the $1200 resistance. The ratio has been in a slight uptrend since then, however unable to lock-in any meaningful advance, despite gold firming to $1280 on Dec 28. Speculators might attribute the poor miner advance after Xmas to the roll-over of the COMEX contract to Jan 2019 as leading month, adding some contango premium to the gold price. Tax-loss selling always is yet another good excuse for miners to lag upon any hesitation of the gold price during Nov and Dec.
Six months ago, HUI/Gold posted at 0.14 with the yellow metal a few percent lower than where it stands at today. As soon as investors run out of excuses as why to sell regardless the gold price trend, we may revisit that 0.14 level again. That wouldn't be exaggerated at all, given that HUI/Gold was at 0.155 by the end of 2017 with gold at $1300. The yellow metal is down only 1.7% over 2017, despite USD strength and four rate hikes.
Long term retrospect
The below graph with weekly observations of HUI/Gold over three years, shows the 2011-15 bear market bottom (actually by mid Jan 2016) followed by the euphoria of the gold and miners breakout and the new slide to bear market valuations.
 |
| HUI/Gold ratio - Weeky observations over 3 years (click to enlarge) |
Moving averages on a weekly graph standard are 50 and 200 weeks. The red longest term moving average has been trimmed to 150 weeks or nearly 3 years. It is almost completely flat, essentially showing the bear market bottom. HUI/Gold stays below the declining blue 50 weeks moving average throughout most of 2017 and 2018.
Table I : prices at the Dec 28, 2018 close
Last
|
Up from Min
|
Min
|
Max
|
Down from max
|
|
Gold
|
1280.4
|
13.5%
|
1,128.2
|
1,357.7
|
-5.7%
|
HUI
|
158.1
|
18.0%
|
134.0
|
221.5
|
-28.6%
|
Table 1 illustrates where gold and the HUI miners index currently are relative to their 2017-2018 closing max and min. Note that the closing max and min for gold and for the HUI were not on the same date. Gold only quotes 5.7% below its rolling 24 months high and 13.5% above its low.
The HUI index on the contrary has much more work to do, quoting 28.6% below its rolling 24 months high.
Silver miners losing their edge
An aggregate idea of what's going on in the narrow niche market of silver miners is not evident. The best proxy around is the Global-X Silver Miners ETF with ticker SIL. The below graphs show SIL/Silver year-to-date and over six months.
 |
| SIL/ Silver ; daily observations since the beginning of 2018 |
 |
| SIL/ Silver ; daily observations over 6 months |
The situation among silver miners is actually worse than that for gold miners. SIL/Silver didn't put a 2018 low in September. Instead the ratio kept trending down with new lows in November. The mid Dec recovery was mainly due to the rally of streamer Wheaton Precious Metals, which is a key component in SIL. The recent recovery of the silver price above $15 is again met with disbelief as miners are -at best- are responding timidly.
Silver miners (long term retrospect)
On the long term retrospect we start with the 2016 boom-bust, which is followed by a gradual erosion of the SIL/Silver ratio over 2017-2018. The 150 weeks moving average (red) still signals an uptrend, indicating that SIL used to withstand the silver slide (about 70% off since the speculative Apr 2011 top) better than gold miners could cope with the gold slide (by now only about 30% off the Aug 2011 all-time high).
 |
| SIL/Silver ratio - Weeky observations over 3 years (click to enlarge) |
Yet SIL/Silver keeps below its 50 weeks moving average over most of 2017 and 2018, much in the same way as we found for HUI/Gold.
Repeatedly, SIL/Silver has been weakening as silver recovered while occasionally also showing resilience as silver was sliding. The rationale behind may be important secondary production streams of base metals. A silver miner earning about half its revenue from copper won't rally excessively upon silver strength as the price of copper stays put.
Canadian Gold and Silver Mining indices
 |
| GMP list based (and capitalisation weighed) gold (yellow dots), silver (blue) and equal weight (red) miners indices. Reference 1000 on Nov 19, 2010 (click to enlarge) |
The third index added uses equal initial weights of all (silver and gold) miners from the GMP database. Because of its simple weighting scheme, comparing this index to the capitalization weighted indices gives a fair idea of how junior miners and explorers fare as compared to the large miners.
How we got so deep into trouble is best illustrated when showing a long term graph of those capitalization weighted miners indices. The revival after late Jan 2016 healed the last leg down of the miner bear market. We briefly topped the May 2013-Oct 2014 trading range.
 |
| Long term graph of the GMP list based (and capitalisation weighed) gold (black), silver (blue) and equal weight (red) miners indices. Reference 1000 on Nov 19, 2010. - Data till Dec 29, 2017 (click to enlarge) |
The silver miners index rose till 1400 in April 2011, peaking three weeks earlier than did the silver price. The silver miners index also posted a higher maximum during both the March 2014 and June to early August recovery than it did in the August 2013 recovery. The gold miners index and the equal weight index did not peak higher at any of the failing 2014-15 recoveries than they did in August 2013. By January 2016 silver miners nearly completely lost their edge relative to gold miners, yet the recovery proved more vigorous. The below long term graph covers over three years: the end of the bear market with miners bottoming by Dec 2015, the 2016 boom-bust over the tedious months early 2018, with miners unable to match gold strengthening. Miner quotes were jittery after gold plunged below $1200. Towards end 2018 gold strengthened to $1280 with miners recovering timidly.
 |
| Mid/Long term graph of the GMP list based (and capitalisation weighed) gold (black), silver (blue) and equal weight (red) miners indices. Reference 1000 on Nov 19, 2010. - Data till Dec 28, 2018 (click to enlarge) |
Performance graphs
There is an important performance disparity among the gold and silver miners of the GMP database. Too many laggards seem moribund. The median (or middle) miner (with an equal number better and worse) is losing 71.53%: tripling doesn't bring you to break even. The average loss posts at 48.49% as the performance distribution is slanted towards the (few) high gains.
 |
GMP Miners sorted by loss to gain since inception on Nov 19, 2010. Click to enlarge
|
There are 21 miners/explorers losing 90% or more, with 13 thereof down over 95%. At the opposite side only 13 miners are still quoting above their Nov 2010 mark, led by Osisko Mining; 3 stocks have doubled. The top 4 miners are omitted in the above graph to avoid scale expansion, but you find the top-10 in full detail below:
 |
GMP elite miners, sorted by gain since starting observations in Nov 2010 using a logarithmic view with minor ticks 10% apart in the bottom decade and 100% apart in the next decade - Click to enlarge
|
Individual miner performance of all Gold Miner Pulse (GMP) database components.
Reference date
Miner performance calculated is relative to the start of the calculation of the GMP based gold miners and silver miners index on Nov 19, 2010. For your information: gold closed at US$1342/oz and silver at US$27.07/oz on that day.Bear market damage
With hindsight: from early 2011 onward miners started lagging precious metals in their ascent to all time highs. The harsh miner bear market decimated the majority of explorers. Acquisitions continued, but hefty premiums no longer were paid. There have been some bankruptcies among miners and some more delistings of explorers running low on cash and assets. You find an overview of list compositions changes at the end.Today's statistics
On Dec 28, 2018 the median loss for the miners in the database stands at 71.53%, while the average loss is 48.49%. The median is the value observed in the middle of the distribution.Since previous evaluation on Dec 14, 2018 the average advances 3.71%, however the median loss only adds 0.93%. Advances are more widespread and more pronounced among miners quoting above the median.
Over the long haul,21 miners are down 90% or more with 13 thereof down over 95%.
Only 13 miners are up since Nov 2010 led by Osisko Mining. The top 3 have doubled.
For the second time in a row advances (62 miners) outnumber declines (20) on consecutive evaluations. The remainder of the set of miners (12) quotes almost flat: within a narrow +1% range. And a silver lining: the aggregate miner performance by the end of this 4th quarter (-48.49%) ends higher than the third (-51.53%).
Exchange rate
Most quotes are in CAD and likewise all performance graphs illustrate the return in CAD.B2 Gold (BTG), Randgold (GOLD), Barrick (ABX), Hecla Silver (HL), Coeur d'Alène (CDE) and Wheaton Precious Metals (WPM) quote in USD. Their performance has been compensated for the long term depreciation of the loonie.
Latest / Expected list changes
As Barrick is to merge with Randgold another quote will leave the selection. The combined business will 'inherit' the position of the better performing Randgold. This is the last update including ABX and GOLD as separate quotes.Tahoe Resources will be acquired by Pan American Silver (PAAS). We will keep the quote of PAAS.
Red Eagle Mining (R) left the selection after bankruptcy. Teranga Gold Corporation (TGZ) replaces R.
Eldorado Gold is completing its reverse split next Monday Dec 31, 2018.
Graphs section
Individual miner performance since Nov 19, 2010. Miners are identified by their TSX trading symbols.
Click any of the graphs to view them at true size
 |
| Top quintile: the best 20% of miners |
 |
| Subtop quintile |
 |
| Subtop quintile, observation on Sep 21, 2018. |
 |
| Midrange quintile: by definition you find the median in this quintile |
 |
| Laggards quintile |
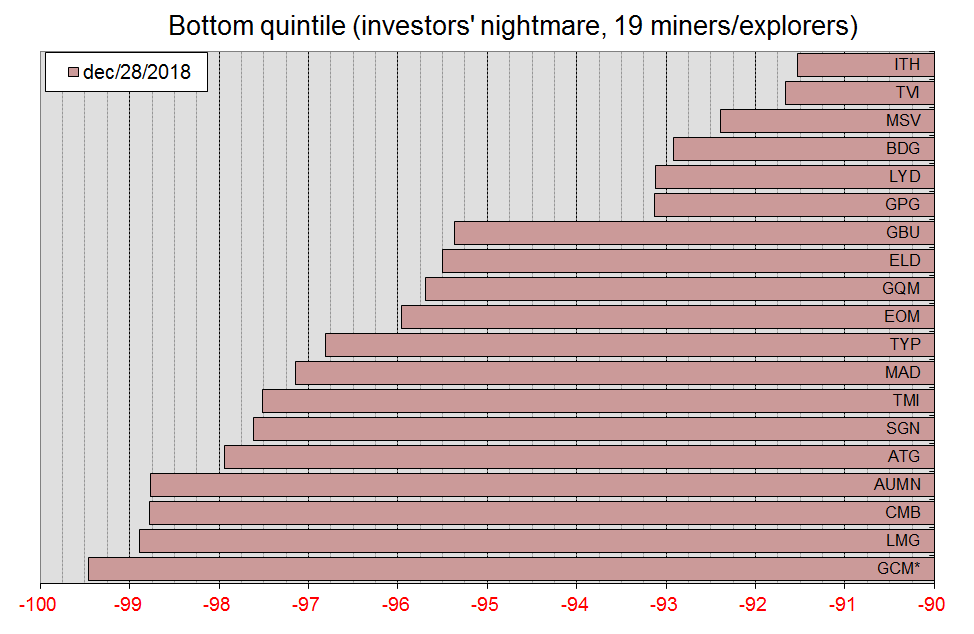 |
| Bottom quintile, the mining investors' nightmare. With losses in excess of 95% for 13 miners, those really are the basket cases. |
Comments and composition changes in 2018:
- Alio Gold (ALO) replaces Rye Patch Gold (RPM) upon a business combination of both. ALO 'inherits' the track record of RPM.
- Primero has been delisted after its acquisition by First Majestic.
- Klondex was acquired by Hecla Mining. Coverage is discontinued and Klondex has been delisted.
- After a friendly take-over bid of the Australian South32 miner on Arizona Mining (AZ), this top performer eventually left the selection.
- We introduced Gold Standard Ventures (GSV) to our list in replacement of AZ mining.
- After the bankruptcy of Red Eagle Mining (R), Teranga Gold Corporation (TGZ) was added in replacement.
- A few name changes:
- Novacopper (NCQ) now is called Trilogy metals (TMQ)
- Astur Gold (AST) changed to Black Dragon Gold (BDG)
- Pilot Gold (PLG) changed to Liberty Gold (LGD)
- Silver Wheaton (SLW) changed its name to Wheaton Precious Metals (WPM)
- Silver Standard Resources changed to SSR Mining with ticker SSRM
- And ticker changes:
- Kirkland Lake Gold (KGI) changed its TSX ticker to KL
- Red Eagle Gold changed over to the main market. Its TSX ticker now is R.
- Pan American Silver changed its TSX ticker to PAAS (in line with that on US markets)
- Golden Minerals changed its TSX ticker to AUMN (also in line with that on US markets)
The quote list: If the Toronto Stock Exchange (TSX) symbols are less familiar, you find the mining or exploration company name next to the TSX symbol in the below list, former names are indicated between brackets:

Outlook for 2019
There are opposing economic forces and trends blurring the outlook for precious metals.
The FED rate hikes have lifted the 'short end', thereby flattening the maturity curve. The quantitative tightening normally should support or may lift the high end of the maturity curve, much in the same way as QE used to suppress the LT bond yields. However, enough private demand for bonds may counterbalance the effect of the quantitative tightening. Anyhow, future rate hikes still support the USD and high yields are an impediment for gold to strengthen much in the near future.
Yet gold has been rallying into January for several years now, regardless of prior FED actions or its hawkish rhetoric and rate hike perspectives.
Yet gold has been rallying into January for several years now, regardless of prior FED actions or its hawkish rhetoric and rate hike perspectives.
Pres. Trump's trade policy has been hampering economic growth worldwide and tariffs lift prices in the US, leading to a higher inflation. Less competitive and more expensive domestic production now is at level playing field with imported goods. It ultimately is the US consumer paying the bill, while the US government rakes in some windfall tax profits.
A less desirable result is the undermining of purchasing power, unless wages are raised substantially. Both alternatives harm future economic growth. The first option brings the R-word awfully close, while the second may lead to stagflation and ultimately escalating long term interest rates.
Last scenario would weaken the greenback and be beneficial for the gold price advancing substantially. Trade wars and economic sanctions also are undermining the faith in the USD and the international clearing system. Both Russia and China are reducing their USD holdings and are buying substantial quantities of gold instead.
National banks buying gold rather than leasing or selling causes a landslide change in demand, which now is less prone to the fear-driven and shaky investor demand. This may put a floor underneath the gold price, making the $1000-$1100/oz scenario extremely unlikely.
Mine production is staying level and may decline in the near future since most development projects dating from the 2005-2012 gold boom period have been put into production and exploration was hampered during the past gold market bear. Exploration finds less ounces are than yearly mine production.
Both from the demand side as the production side, mid to long term perspectives for the gold price are definitely beneficial. Whether these perspectives will already be realized in 2019 remains an open question.
Related blog articles
Several more detailed articles focusing on the longer term have been published. These are using the same approach as this blog page and still are a good read to grasp the historic perspective:- Miners relative to precious metals: a tactical approach; (July 2, 2012)
- Miners relative to precious metals: An update on 2012; (Jan 13, 2013)
- Anatomy of a gold miner bear market (Dec 30, 2013)
- Three year slide of precious metal miners (Dec 31, 2014)
- Gold miner bear market starting its fifth year (Jan 3, 2016)
- Precious metal miners relative to metal prices (Dec 31, 2016)
- Gold Miner Pulse 2019 (half-year update) (1-07-2019)
No comments:
Post a Comment