Unhedged Gold miners relative to Gold bullion
The HUI/Gold ratio kept range bound as did the yellow metal near $1500/oz. The early Nov plunge of gold didn't bring about a catastrophic collapse of miners. Yet persisting gold weakness is preventing any progress. As we are nearing the end of 2019, enthusiasm for miners has returned, even while the yellow metal was meandering below $1500/Oz. After some hesitation gold rallying above $1500/Oz again propels miners. HUI/Gold ends the year on a high.
How we got there:
The HUI/Gold ratio kept range bound as did the yellow metal near $1500/oz. The early Nov plunge of gold didn't bring about a catastrophic collapse of miners. Yet persisting gold weakness is preventing any progress. As we are nearing the end of 2019, enthusiasm for miners has returned, even while the yellow metal was meandering below $1500/Oz. After some hesitation gold rallying above $1500/Oz again propels miners. HUI/Gold ends the year on a high.
 |
| Unhedged Gold Miners index HUI relative to gold bullion (spot market). Daily observations over 6 months - Click to enlarge |
 |
| Unhedged Gold Miners index HUI relative to gold bullion (spot market). Daily observations over 12 months - Click to enlarge |
How we got there:
Previous longer term review has been posted end December 2018: Precious metals mining in 2018: a dark cloud with a silver lining & 2019 outlook .
Gold rallying to $1247 early December 2018 made miners advance substantially. Though the trend quickly reversed upon little gold weakness. The on-off game continued into 2019 with the HUI/Gold ratio unable to lock in a meaningful advance.
By January 25 gold broke above $1300 which made HUI/Gold regain its 50 dma and gold firming to $1320 by end Jan 2019 ultimately caused HUI/Gold to reach its declining 200 dma. The Chinese new year rally lifted HUI/Gold above its 200 dma. It seems ages ago we last enjoyed this situation.
While gold kept flirting with the $1300 price tag, HUI/Gold was trending higher. Thereafter everything was on the brink again. HUI/Gold slid from a 6 months high to what was going to be the 2019 low towards the last week of May.
A real recovery started off on May 31st with gold rallying. Gold breaking above $1300 again spurred enthusiasm for the miners, however after the initial rally, sentiment turned quite meek. Only gold breaking above its 4 year trading range has been lifting the HUI/Gold ratio breaking its late March high by end June and steaming up as gold firmed well above $1400. Towards end July, gold volatility started weighing on miner sentiment, though the yellow metal firmly kept above $1400, with that level becoming a support. Large gyrations of HUI/Gold are an indication of poor gold-miner correlation. Early to mid August, stock market weakness spilled over into mining stocks. It has been an on-off story throughout Sept & October.
The HUI/Gold regression (previously also called 'bear market logic'): a linear but non-proportional relationship between HUI and Gold puts HUI/Gold (or for that purpose Gold/XAU) as valuation parameter in a different perspective. The HUI index has been calculated since 1996.Gold rallying to $1247 early December 2018 made miners advance substantially. Though the trend quickly reversed upon little gold weakness. The on-off game continued into 2019 with the HUI/Gold ratio unable to lock in a meaningful advance.
By January 25 gold broke above $1300 which made HUI/Gold regain its 50 dma and gold firming to $1320 by end Jan 2019 ultimately caused HUI/Gold to reach its declining 200 dma. The Chinese new year rally lifted HUI/Gold above its 200 dma. It seems ages ago we last enjoyed this situation.
While gold kept flirting with the $1300 price tag, HUI/Gold was trending higher. Thereafter everything was on the brink again. HUI/Gold slid from a 6 months high to what was going to be the 2019 low towards the last week of May.
A real recovery started off on May 31st with gold rallying. Gold breaking above $1300 again spurred enthusiasm for the miners, however after the initial rally, sentiment turned quite meek. Only gold breaking above its 4 year trading range has been lifting the HUI/Gold ratio breaking its late March high by end June and steaming up as gold firmed well above $1400. Towards end July, gold volatility started weighing on miner sentiment, though the yellow metal firmly kept above $1400, with that level becoming a support. Large gyrations of HUI/Gold are an indication of poor gold-miner correlation. Early to mid August, stock market weakness spilled over into mining stocks. It has been an on-off story throughout Sept & October.
Global X Silver Miners ETF (SIL) relative to silver bullion
Early to mid August, broad stock market weakness completely disrupted the uptrend among silver miners. Silver above $17 seemed having become a non-issue. SIL/Silver still is way below its March & July double top. The ratio fails regaining its 50 dma and is trending lower. A bearish cross was made as the 50 dma crossed below the 200 dma. A first step to recovery now should be SIL/Silver breaking above its declining 50 dma again; we needed silver regaining $18 to achieve this. Remarkably the early Nov and Dec slide of precious metals -with silver back below $17- didn't bring about a collapse of miners. Silver miners prove exceptionally resilient. As silver is nearing $17/Oz again, SIL/Silver remains well above its 200 dma, with the 50 dma having put a golden cross. After some hesitation silver miners again propel higher as the metal keeps firming.
How we got there:
Early to mid August, broad stock market weakness completely disrupted the uptrend among silver miners. Silver above $17 seemed having become a non-issue. SIL/Silver still is way below its March & July double top. The ratio fails regaining its 50 dma and is trending lower. A bearish cross was made as the 50 dma crossed below the 200 dma. A first step to recovery now should be SIL/Silver breaking above its declining 50 dma again; we needed silver regaining $18 to achieve this. Remarkably the early Nov and Dec slide of precious metals -with silver back below $17- didn't bring about a collapse of miners. Silver miners prove exceptionally resilient. As silver is nearing $17/Oz again, SIL/Silver remains well above its 200 dma, with the 50 dma having put a golden cross. After some hesitation silver miners again propel higher as the metal keeps firming.
 | |
|
 | |
|
Previous longer term review has been posted end December 2018: Precious metals mining in 2018: a dark cloud with a silver lining & 2019 outlook .
In the first half year of 2018, silver miners reacted adversely to the silver price trend. Initially silver miners had shown some resilience despite metal weakness. Yet they didn't benefit from the early October silver recovery either. With the metal lingering on below $15/Oz, silver miners lost their edge. The mid December advance mainly reflected the rally of streamer Wheaton Precious Metals. The SIL/Silver ratio turned south again, though silver broke above $15/oz.
SIL/Silver only turned up as the metal resumed its uptrend finally breaking above $16/oz by Jan 31, 2019. Silver pausing its recovery raised some doubt, yet SIL/silver broke above its 200 dma. With the metal oscillating around $15/Oz, the SIL/silver ratio curbed and then broke down again. Silver sliding further wasn't any help. As precious metals started firming on May 31st, miners rallied.
However silver miner enthusiasm remained subdued while the metal kept struggling to break above $15/Oz. Only silver finally getting traction and quickly breaking its 2019 high above $16 rejuvenated enthusiasm for silver miners. Silver miner sentiment however keeps being shaky, with SIL/Silver unable to meaningfully break above its late March top.
In the first half year of 2018, silver miners reacted adversely to the silver price trend. Initially silver miners had shown some resilience despite metal weakness. Yet they didn't benefit from the early October silver recovery either. With the metal lingering on below $15/Oz, silver miners lost their edge. The mid December advance mainly reflected the rally of streamer Wheaton Precious Metals. The SIL/Silver ratio turned south again, though silver broke above $15/oz.
SIL/Silver only turned up as the metal resumed its uptrend finally breaking above $16/oz by Jan 31, 2019. Silver pausing its recovery raised some doubt, yet SIL/silver broke above its 200 dma. With the metal oscillating around $15/Oz, the SIL/silver ratio curbed and then broke down again. Silver sliding further wasn't any help. As precious metals started firming on May 31st, miners rallied.
Canadian Gold and Silver Mining indices
 |
| GMP list based (and capitalization weighed) gold (yellow dots), silver (blue) and equal weight (red) miners indices. Reference 1000 on Nov 19, 2010 (click to enlarge) |
The third index added uses equal initial weights of all (silver and gold) miners from the GMP database. Because of its simple weighting scheme, comparing this index to the capitalization weighted indices gives a fair idea of how junior miners and explorers fare as compared to the large miners.
How we got so deep into trouble is best illustrated when showing a long term graph of those capitalization weighted miners indices. The revival after late Jan 2016 healed the last leg down of the miner bear market. We briefly topped the May 2013-Oct 2014 trading range.
 |
| Long term graph of the GMP list based (and capitalisation weighed) gold (black), silver (blue) and equal weight (red) miners indices. Reference 1000 on Nov 19, 2010. - Data till Dec 29, 2017 (click to enlarge) |
The silver miners index rose till 1400 in April 2011, peaking three weeks earlier than did the silver price. The silver miners index also posted a higher maximum during both the March 2014 and June to early August recovery than it did in the August 2013 recovery. The gold miners index and the equal weight index did not peak higher at any of the failing 2014-15 recoveries than they did in August 2013. By January 2016 silver miners nearly completely lost their edge relative to gold miners, yet the recovery proved more vigorous. The below long term graph covers over three years: the end of the bear market with miners bottoming by Dec 2015, the 2016 boom-bust over the tedious months early 2018, with miners unable to match gold strengthening. Miner quotes were jittery after gold plunged below $1200. Towards end 2018 gold strengthened to $1280 with miners recovering timidly.
 |
| Mid/Long term graph of the GMP list based (and capitalisation weighed) gold (black), silver (blue) and equal weight (red) miners indices. Reference 1000 on Nov 19, 2010. - Data till Dec 6, 2019 (click to enlarge) |
There is an important performance disparity among the gold and silver miners of the GMP database. Many laggards still seem moribund. The median (or middle) miner (with an equal number better and worse) is losing 55.73%: more than a doubling is needed to break even. The average loss posts at 26.65% as the performance distribution is slanted towards the high gains.
There are 12 miners/explorers losing 90% or more, with 3 thereof down over 95%. At the opposite side 18 miners are quoting above their Nov 2010 mark, now led by Osisko Mining; 8 stocks have doubled. These top 8 miners are omitted in the above graph to avoid excessive scale expansion, but you find the top-14 in full detail below:
A more detailed analysis including list composition changes, is found in the below section and regular updates are also published on the page "miners performance". The miners included in the database are classified in five performance quintiles. This allows evaluating how individual miners went with the herd or against the grid.
 |
| GMP Miners sorted by loss to gain since inception on Nov 19, 2010. Click to enlarge |
 |
| GMP elite miners, sorted by gain since starting observations in Nov 2010 using a logarithmic view with minor ticks 10% apart in the bottom decade and 100% apart in the next decade - Click to enlarge |
A more detailed analysis including list composition changes, is found in the below section and regular updates are also published on the page "miners performance". The miners included in the database are classified in five performance quintiles. This allows evaluating how individual miners went with the herd or against the grid.
Gold miners' performance section:
Reference date
Miner performance calculated is relative to the start of the calculation of the GMP based gold miners and silver miners index on Nov 19, 2010. For your information: gold closed at US$1342/oz and silver at US$27.07/oz on that day.
Bear market damage
With hindsight: from early 2011 onward miners started lagging precious metals in their ascent to all time highs. The harsh miner bear market decimated the majority of explorers. Acquisitions continued, but hefty premiums no longer were paid. There have been some bankruptcies among miners and some more delisting of explorers running low on cash and assets. You find an overview of list compositions changes at the end.
Today's statistics
Today the median loss for the miners in the database stands at 55.73%, while the average loss is 26.65%. The median is the value observed in the middle of the distribution.
Over the long haul, (again) 12 miners are down 90% or more with 3 thereof down over 95%.
Still 18 miners are up since Nov 2010, now led by Osisko Mining. The top 8 have doubled.
Since previous evaluation on Dec 20, 2019 the median advanced 3.44% yet the average rallied 5.27%.
Since previous evaluation on Dec 20, 2019 the median advanced 3.44% yet the average rallied 5.27%.
Advances (80) led declines (5 miners) on consecutive evaluations. The remainder of the set of miners (9) quotes almost flat: within a narrow +1% range.
Exchange rate
Most quotes are in CAD and likewise all performance graphs illustrate the return in CAD.
B2 Gold (BTG), Barrick (GOLD), Hecla Silver (HL), Coeur d'Alène (CDE) , Newmont Mining (NEM) and Wheaton Precious Metals (WPM) quote in USD. Their performance has been compensated for the long term depreciation of the loonie.
Redesign
'Quintile' bar graphs overlap by one miner/explorer. This facilitates visually pinpointing any performance gap. The bottom ranking miner of the higher quintile is repeated at the top of the lower quintile.
Some list components didn't quote daily any longer. Without any exception these were penny stocks, valued below CAD 0.10. Their market capitalization was below 10 M CAD. Not surprisingly, these stocks were down over 90%.
Following explorers or miners have therefore been excluded: Atlanta Gold (ATG), TVI Pacific (TVI), CMC metals (CMB), Miranda Gold (MAD), Black Dragon Gold (BDG), Lincoln Mining Group (LMG), Eco Oro Min (EON) and Golden Queen Min (GQM). Weeding out these moribund explorers or miners made it harder for the remaining laggards to break away from the bottom quintile.
Latest / Expected list changes
NGEx resources spun off its Los Helados project and various exploration properties into a new NGEx minerals (NGEX quoting on the Toronto Venture exchange) while focusing on the development on the José Maria copper-gold project in San Juan, Argentina. Accordingly the name was changed to Josémaria resources.
Graphs section
Individual miner performance since Nov 19, 2010. Miners are identified by their TSX trading symbols.
Click any of the graphs to view them at true size
 |
| Top quintile: the best 20% of miners |
 |
| Subtop: the average decline is amid this quintile |
 |
| Midrange quintile: by definition you find the median in the middle of this quintile. |
 |
| Laggards quintile |
 |
Investors nightmare: Miners in the lower part of this quintile are down over 90%
The bottom 3 are down over 95%: those really are the basket cases
|
 |
| Top quintile: the best 20% of miners |
Comments and composition changes since 2018:
- Alio Gold (ALO) replaces Rye Patch Gold (RPM) upon a business combination of both. ALO 'inherits' the track record of RPM.
- Primero has been delisted after its acquisition by First Majestic.
- Klondex was acquired by Hecla Mining. Coverage is discontinued and Klondex has been delisted.
- After a friendly take-over bid of the Australian South32 miner on Arizona Mining (AZ), this top performer eventually left the selection.
- We introduced Gold Standard Ventures (GSV) to our list in replacement of AZ mining.
- After the bankruptcy of Red Eagle Mining (R), Teranga Gold Corporation (TGZ) was added in replacement.
- Upon the merger of Barrick and Randgold, the more appealing Randgold ticker GOLD was maintained, whereas the merged mining company is called Barrick. The ticker ABX is removed and the reference share price is divided by the 6.128 Randgold share exchange value. Randgold shareholders thereby obtain 33% of the new Barrick.
- Nighthawk (NH.TO) has been added to the list.
- Atlanta Gold (ATG), TVI Pacific (TVI) and CMC metals (CMB), Black Dragon Gold (BDG.V), Lincoln Mining Corp (LMG) and Miranda Gold (MAD) were dropped from the list. These explorers don't quote daily any longer. They have become hard to trade as market cap dwindled to a few million CAD.
- Subsequently also Black Dragon Gold (BDG), Lincoln Mining Group (LMG), Eco Oro Min (EON) and Golden Queen Min (GQM) were dropped in March 2019.
- Tahoe Resources was acquired by Pan American Silver (PAAS) as of Feb 22, 2019
- Several replacements have been added to the list after mergers and de-listings. Those are Golden Arrow Gold (GRG) on the Toronto venture exchange, Alacer Gold (ASR), Belo Sun Mining (BSX), Marathon Gold (MOZ), Midas Gold (MAX) and Roxgold (ROXG) on TSX. Newmont (NEM) - NYSE in USD were also added. Subsequent additions were ASA Gold & Precious Metals (ASA), Evrim Resources (EVM), Victoria Gold (VIT), Equinox Gold (EQX)
- Newmont (NEM) has completed the acquisition of Goldcorp (G on TSX and GG on US markets)
- Alexandria Metals (AZX) has been taken over by O3 Mining
- NGEx gold spun off its Los Helados project and various exploration properties into a new NGEx minerals, while focusing on the development on the José Maria copper-gold project in San Juan, Argentina. Accordingly the name was changed to Josémaria resources.
- A few name changes:
- Novacopper (NCQ) now is called Trilogy metals (TMQ)
- Astur Gold (AST) changed to Black Dragon Gold (BDG)
- Pilot Gold (PLG) changed to Liberty Gold (LGD)
- Silver Wheaton (SLW) changed its name to Wheaton Precious Metals (WPM)
- Silver Standard Resources changed to SSR Mining with ticker SSRM
- Eurasian Minerals changed to EMX Royalty Corp. with ticker still EMX
- Gowest Amalgameted Res. changed to Gowest Gold with ticker still GWA
- Tri Metals Mining changed to Gold Springs Recources Corporation with new ticker GRC
- And ticker changes:
- Kirkland Lake Gold (KGI) changed its TSX ticker to KL
- Red Eagle Gold changed over to the main market. Its TSX ticker now is R.
- Pan American Silver changed its TSX ticker to PAAS (in line with that on US markets)
- Golden Minerals changed its TSX ticker to AUMN (also in line with that on US markets)
- Alexco minerals changed its TSX ticker to AXU, in line with that on US markets
The cumulative list of acquisitions or delistings since end 2010 (included below) is quite impressive.
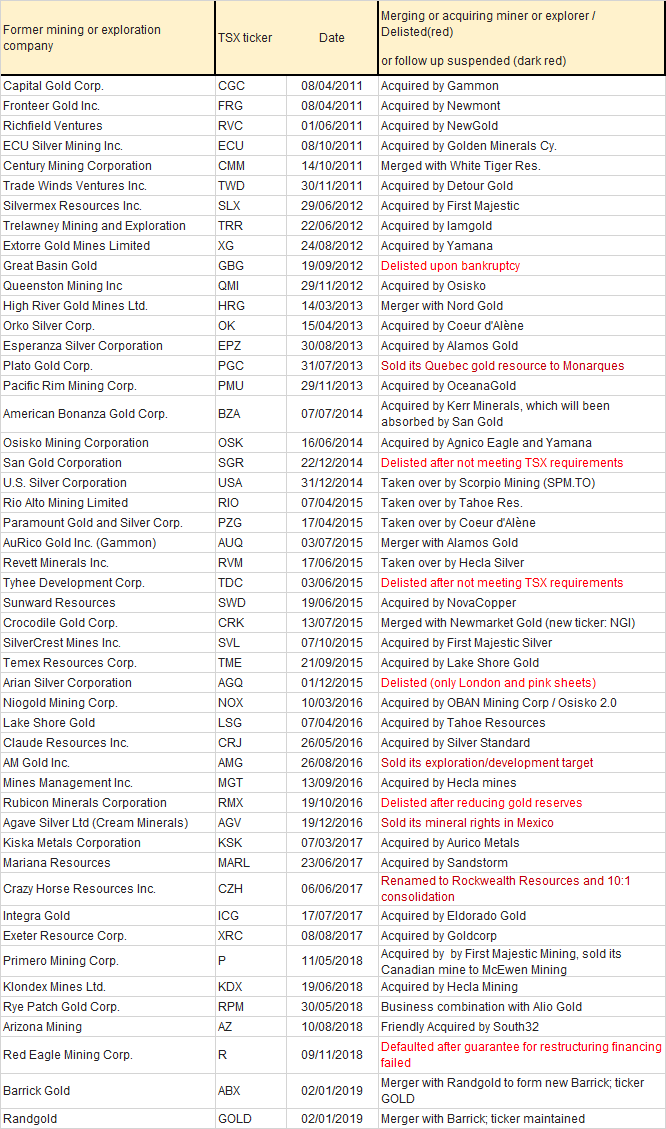
The majority of the Canadian ticker symbols quote at the TSX. A few quote at the TSXV (the less regulated Venture exchange). These companies are intrinsically more risky, especially if a miner or explorer gets demoted from TSX to TSXV. One such example is TVI Pacific.
The quote list: If the Toronto Stock Exchange (TSX) symbols are less familiar, you find the mining or exploration company name next to the TSX symbol in the below list, former names are indicated between brackets:
Quote
|
Name
|
Quote
|
Name
|
AEM
|
Agnico-Eagle Mines Limited
|
JOSE
|
Josémaria Resources Inc.
|
AGI
|
Alamos Gold Inc
|
K
|
Kinross Gold Corporation
|
AKG
|
Asanko Gold
|
KL
|
Kirkland Lake Gold
|
ALO
|
Alio Gold
|
LGD
|
Liberty Gold Inc (Pilot Gold)
|
AMM
|
Almaden Minerals Ltd.
|
LME
|
Laurion Mineral Exploration
|
AR
|
Argonaut Gold
|
LYD
|
Lydian International Limited
|
ASA
|
ASA Gold & Precious Metals
|
MAG
|
MAG Silver Corp.
|
ASM
|
Avino Silver & Gold Mines Ltd.
|
MAX
|
Midas Gold Corp.
|
ASR
|
Alacer Gold Corp.
|
MOZ
|
Marathon Gold Corp.
|
AUG
|
Auryn Resources
|
MQR
|
Monarques Resources
|
AUMN
|
Golden Minerals Company
|
MRZ
|
Mirasol Resources
|
AXU
|
Alexco Resource Corp.
|
MSV
|
Minco Silver Corporation
|
BCM
|
Bear Creek Mining Corporation
|
MTB
|
Mountain Boy Minerals Ltd.
|
BSX
|
Belo Sun Mining Corp.
|
MUX
|
McEwen Mining Inc.
|
BTG
|
B2 Gold
|
NDM
|
Northern Dynasty Minerals Ltd.
|
CDB
|
Cordoba Minerals
|
NEM
|
Newmont Mining
|
CDE
|
Coeur d'Alene Mines Corporation
|
NG
|
NovaGold Resources Inc.
|
CG
|
Centerra gold
|
NGD
|
New Gold Inc.
|
CKG
|
Chesapeake Gold Corp.
|
NHK
|
Nighthawk Gold Corp.
|
CUU
|
Copper Fox Metals Inc
|
OSK
|
Osisko Mining Inc.
|
DGC
|
Detour Gold Corporation
|
OGC
|
Oceana Gold
|
DPM
|
Dundee Precious Metals Inc.
|
OR
|
Osisko Gold Royalties
|
EDR
|
Endeavour Silver Corp.
|
ORA
|
Aura Minerals Inc.
|
EDV
|
Endeavour Mining Corp.
|
PAAS
|
Pan American Silver Corp.
|
ELD
|
Eldorado Gold Corporation
|
PG
|
Premier Gold Mines Ltd.
|
EMX
|
EMX Royalty.Corp.
|
PVG
|
Pretium Resources Inc.
|
EQX
|
Equinox Gold
|
ROXG
|
Roxgold
|
ER
|
Eastmain Resources Inc.
|
RRI
|
Riverside Resources
|
EVM
|
Evrim Resources Corp.
|
SBB
|
Sabina Gold & Silver Corporation
|
EXN
|
Excellon Resources
|
SEA
|
Seabridge Gold Inc.
|
FR
|
First Majestic Silver Corp.
|
SGN
|
Scorpio Gold Corporation
|
FVI
|
Fortuna Silver Mines Inc.
|
SMF
|
Semafo Inc.
|
GAL
|
Galantas Gold Corporation
|
SPA
|
Spanish Mountain Gold Ltd.
|
GBU
|
Gabriel Resources Ltd.
|
SSL
|
Sandstorm Gold
|
GCM
|
Gran Colombia Gold Corp
|
SSRM
|
Silver Standard Resources Inc.
|
GOLD
|
Barrick-Randgold
|
SVM
|
Silvercorp Metals Inc.
|
GPG
|
Grande Portage Res.
|
TGZ
|
Teranga Gold Corporation
|
GPR
|
Great Panther Silver Ltd
|
GRC
|
Gold Springs Resources (Tri Met. Min.)
|
GRG
|
Golden Arrow Res. Corp
|
TML
|
Treasury Metals Inc.
|
GSV
|
Gold Standard Ventures
|
TMQ
|
Trilogy Metals Inc.
|
GUY
|
Guyana Goldfields Inc.
|
TSN
|
Telson Resources (Soho)
|
GWA
|
Gowest Amalgamated Res.
|
TXG
|
Torex Gold
|
HL
|
Hecla Silver
|
TYP
|
Typhoon Exploration Inc.
|
HRT
|
Harte Gold Corp.
|
USA
|
Americas Silver
|
IMG
|
Iamgold
|
VIT
|
Victoria Gold Corp.
|
IPT
|
Impact Silver Corp.
|
WPM
|
Wheaton Precious Metals
|
ITH
|
Internat. Tower Hill Mines Ltd.
|
YRI
|
Yamana Gold Inc.
|
The contributor driven explorer and (junior) mining spreadsheet
Pooling efforts with any cooperative peers out there, I started the “contributor driven explorer and junior mining spreadsheet” end 2011. The idea is to get a selection of explorers, junior or mid-tier producers of gold and/or silver. This spreadsheet is updated weekly. Sector benchmarks (ETF's) were added since the very start.
Related blog articles
Several more detailed articles focusing on the longer term have been published. These are using the same approach as this blog page and still are a good read to grasp the historic perspective:- Miners relative to precious metals: a tactical approach; (July 2, 2012)
- Miners relative to precious metals: An update on 2012; (Jan 13, 2013)
- Anatomy of a gold miner bear market (Dec 30, 2013)
- Three year slide of precious metal miners (Dec 31, 2014)
- Gold miner bear market starting its fifth year (Jan 3, 2016)
- Precious metal miners relative to metal prices (Dec 31, 2016)
- Precious metal mining in 2018: a dark cloud with a silver lining and 2019 outlook (29 Dec 2018)
- Gold Miner Pulse 2019 (half-year update) (1-07-2019)
During 2011-15 and even over the long haul, the relative performance of mining majors to the precious metals they produce was disappointing for major gold miners, even while the metals were in a solid uptrend. See: Gold miners: three decades for naught or Decades of underperformance
Outllook for 2020
Regression relationships
Remarkably, during the gold miner bear market, the 2016 boom-bust and subsequent recoveries till summer 2017 the HUI - gold relationship followed a linear regression. Thereby the HUI slid dis-proportionally during any gold decline, but also showed the expected leverage at a gold advance. See for example: Linear Regression between the Gold Price and the HUI miners index (April 2017).
In 2018 it became obvious that the HUI once more had started lagging this observed relationship. Last September a New linear regression between the HUI miners index and the Gold Price was revealed. That reference article also pinpoints the fundamental differences between the key parameters of the successive regression relationships.
Gold outlook
Demand considerations
Since 2020 is a US presidential election year, Pres Donald Trump is doing anything possible to stave off any recession risk, which would endanger his chances for a second presidential term. This implies that the FED will be urged to keep accommodating financial markets easing whenever deemed necessary. The USD has been strengthening during much of 2019, but the USD index now is over the hill. During 2020 we may see a weaker dollar which is favourable for the gold price in USD.Foreign central banks have been buying gold during 2019. The Russian and Chinese central banks were the largest buyers on the market.
The US has been abusing the financial system while imposing economical sanctions on regimes and nations it considers enemies. Freezing assets and excluding foreign banks from the clearance system of international payments are the main financial sanctions often taken. Thereby D. Trump is also threatening with retaliations upon any banks and companies from allied countries reluctant to adopting the same policies. As a result the USD is more often perceived as the currency of a hostile nation which is undermining its role as a reserve currency. Several gold exchanges (e.g. Shanghai) were set up in an effort to enable trading gold in other currencies.
The zero interest rate policy (ZIRP) adopted by many OECD countries, with negative interest rates in Europe and Japan, makes holding gold an obvious alternative for preserving wealth. The slide of interest rates in the US, with negative real interest rates leads US citizens on the same path. Inventories of bullion ETFs are on the rise again.
Supply considerations
Mining enterprises posting a year over year increase of production have become the exception rather than the rule. Moreover several owe their production increase to a merger or acquisition. Global production no longer seems to be growing. Meanwhile, reserves are declining, which makes miners more anxious to try acquiring new resources while explorers are still cheap. Several miners made substantial investments in promising junior explorers or developers to enable them to continue their projects.
Price outlook
The price outlook for gold therefore doesn't look bad at all. The uptrend that started end May 2019 therefore has not run its course yet. The rapid gold rally leading to the $1550 high brought along a healthy correction bottoming around $1450: well above what used to be the top of the trading range of the last five years. The year end rally -bringing gold back to $1515 on Dec 30- may therefore continue into 2020. The 2019 top may soon be exceeded. A comparable price rise of the yellow metal over 2020 to that we witnessed in 2019 is possible. Gold may peak above $1700 and a sustainable gold quote above $1600 by end 2020 is well in the cards.
Mining outlook
At large miners will be helped by margins expanding due to higher gold prices. I wish to refer to the articles mentioned above on the new linear regression as a guideline for the aggregate trend among major miners. Over 2019, the HUI miners index advanced 50.67% against 28.88% for the S&P500 and 22.34% for the DJ Ind. It should however be borne in mind that long term returns for the main indices are far superior to that of gold mines. Both the HUI (Basket of un-hedged gold miners) and the Philadelphia Gold&Silver index (XAU) are notably more volatile and suffer devastating losing streaks during gold bear markets.
Streamers and royalty companies are more resilient during a mining bear market than miners are. Most often any precious metals and miners slump enables them to deploy capital buying streams of future production at a substantial discount. Franco Nevada (FNV), Royal Gold (RGLD) and Wheaton Precious Metals (WPM) are the larger ones in this sector.
Streamers and royalty companies are more resilient during a mining bear market than miners are. Most often any precious metals and miners slump enables them to deploy capital buying streams of future production at a substantial discount. Franco Nevada (FNV), Royal Gold (RGLD) and Wheaton Precious Metals (WPM) are the larger ones in this sector.
Some recovery candidates among solid mining companies having faced a setback last year or last few years and may provide superior returns. Last article "How raising capital reduces market capitalization" gives a fair example. McEwen Mining plunged to $1.02 intraday early December, rallying to $1.30 yesterday Dec 30. Exploration successes and the expanding reserve base open the perspective for an increasing production in 2020 and beyond.
Eldorado Gold has been the dog of mining companies due to the Greek concerns over their Skouries and Olympias mining projects. Delays and budget overruns are as many reasons still troubling perspectives. Yet the miner about doubled over 2019 after the disputes were eventually settled and an exploitation permit was granted. There probably is room for more progress.
Staying with a confirmed successful miner: Kirkland Lake faced a setback after its acquisition of Detour Gold. Determining an ideal entry level is not evident, yet once you consider its slide overdone, KL may well provide a superior return in 2020.
As explorers & developers will inevitably come into focus when miners need expanding their reserve base, some solid names with proven projects may also provide an opportunity. Names? Seabridge Gold and Osisko Mining both have good exploration projects in Canada with resources expanding and improving.
Lately silver miners made a remarkable recovery, despite the metal still relatively cheap at a gold to silver ratio still above 84. In 2019 that ratio hit a 21st century high at 93.2 in July. With low above ground inventories and a constant or increasing global industrial demand, the silver price rise may outperform that of gold. Especially reviving the still lackluster investor demand could propel prices higher.
No comments:
Post a Comment