With graphs last updated on Mar 13, 2019
The focus of this blog page is on the gold and silver miners from a tactical point of view: how do PM miners perform relative to the price of gold or silver.
I like to 'isolate' this version from the thread of weekly updated blog pages. The abrupt reversion of the gold bull trend and the implosion of all 'white precious metals' indeed is a sudden discontinuity deserving its place in history.
Whereas on Friday, stock markets enjoyed a bear market rally after the corona virus frenzy caused a worldwide slide, precious metals continued their downward spiral. Miners were slaughtered. Not only they had been retreating with common stocks while precious metals upheld or even advanced, now miners again leverage down the precious metals decline. From 52 weeks high to fresh 52 weeks low in little over a fortnight.
Note: The blog page is monitoring whether trends are persisting. Therefore the graphs posted here are showing daily observations year-to-date or with a 6 months time horizon. For the long term reference frame, see the articles referenced at the bottom.
Unhedged Gold miners relative to Gold bullion
If you were hoping that the PDAC curse had been early in 2020, just forget the idea. The very next week we all have experienced what curse was waiting for us.
What preceded:
During autumn 2019, the HUI/Gold ratio kept range bound as did the yellow metal near $1500/oz. The early Nov plunge of gold didn't bring about a catastrophic collapse of miners. Yet persisting gold weakness was preventing any progress. As we were nearing the end of 2019, enthusiasm for miners returned, even while the yellow metal was meandering below $1500/Oz. After some hesitation gold rallying above $1500/Oz again propelled miners. HUI/Gold ended 2019 on a high, but gold rising because of the political tension after the elimination of Qassem Soleimani did not inspire miners. HUI/Gold slid to and broke below its 50 dma. The Vancouver Resource Investment Conference didn't inspire any recovery either. The yellow metal convincingly breaking above $1600 curbed the trend.The onset
Yet the Corona virus frenzy slashed miners and precious metals. HUI/Gold plunged both beneath the 50 dma and the 200 dma. The surprise 50 bp rate FED rate cut launched gold higher again with miners briefly bouncing despite a tepid stock market response. Below you find the graph of last week (March 6) | |
|
If you were hoping that the PDAC curse had been early in 2020, just forget the idea. The very next week we all have experienced what curse was waiting for us.
Chronic of the implosion this past week.
The stock market slide accelerated with precious metals also giving way after peaking on Monday. Tuesday's retreat was but a prelude for the slide that was to follow resulting in the capitulation on Thursday followed by another slide today ending this horrendous week. (The overvalued) Palladium managed to implode over 20% on Thursday. Yet both Platinum and Silver, which had been lagging for years, also were beaten up. Silver slid another 7% by the Friday COMEX close at $14.69.
Miners were slaughtered, with the HUI/Gold ratio falling to the bear market bottom. Today's graph makes previous moves of the past six months seem like 'grating the ceiling'. HUI/Gold abruptly plunged to its Dec 2015 - Jan 2016 bear market bottom.
 |
Unhedged Gold Miners index HUI relative to gold bullion (spot market).
Daily observations over 6 months - Friday March 13 graph - Click to enlarge
|
How we got there (long term):
Previous longer term review has been posted end December 2019: Precious metal and miner 2019 overview and outlook for 2020.
Gold breaking above $1300 again spurred enthusiasm for the miners, however after the initial rally, sentiment turned quite meek. Only gold breaking above its 4 year trading range has been lifting the HUI/Gold ratio breaking its late March high by end June and steaming up as gold firmed well above $1400. Towards end July, gold volatility started weighing on miner sentiment, though the yellow metal firmly kept above $1400, with that level becoming a support. Large gyrations of HUI/Gold are an indication of poor gold-miner correlation.
The HUI/Gold regression: a linear but non-proportional relationship between HUI and Gold puts HUI/Gold (or for that purpose Gold/XAU) as valuation parameter in a different perspective. The HUI index has been calculated since 1996.Gold breaking above $1300 again spurred enthusiasm for the miners, however after the initial rally, sentiment turned quite meek. Only gold breaking above its 4 year trading range has been lifting the HUI/Gold ratio breaking its late March high by end June and steaming up as gold firmed well above $1400. Towards end July, gold volatility started weighing on miner sentiment, though the yellow metal firmly kept above $1400, with that level becoming a support. Large gyrations of HUI/Gold are an indication of poor gold-miner correlation.
Global X Silver Miners ETF (SIL) relative to silver bullion
Silver miners retreated with the broad market, despite metals firming 'for the wrong reason' (political tension after the elimination of the Irani general Qassem Soleimani). SIL/silver slid below its 50 dma. Investors are disappointed that silver keeps lagging gold, with the Au/Ag ratio again in excess of 86. The Vancouver Resource Investment Conference didn't lead to any recovery either. Silver regaining $18 brought some improvement but the Corona virus frenzy slashed both miners and precious metals.
This is where we stood on March 6, 2020.
Who was to predict silver to slide from $18.60 to $14.69 in less than three weeks time? The abrupt slide aggravated this week. Silver miners imploded, reaching bear market valuation as is shown on the new graph.
Silver miners retreated with the broad market, despite metals firming 'for the wrong reason' (political tension after the elimination of the Irani general Qassem Soleimani). SIL/silver slid below its 50 dma. Investors are disappointed that silver keeps lagging gold, with the Au/Ag ratio again in excess of 86. The Vancouver Resource Investment Conference didn't lead to any recovery either. Silver regaining $18 brought some improvement but the Corona virus frenzy slashed both miners and precious metals.
This is where we stood on March 6, 2020.
 | |
|
 | |
|
Mining investors are left empty handed as the implosion not only far exceeds the silver slide, but also eclipses the bear market damage we witnessed in the broad stock market.
How we got there:
Previous longer term review has been posted end December 2019: Precious metal and miner 2019 overview and outlook for 2020.
Early to mid August, broad stock market weakness completely disrupted the uptrend among silver miners. Silver above $17 seemed having become a non-issue. SIL/Silver still is way below its March & July double top. The ratio fails regaining its 50 dma and is trending lower. A bearish cross was made as the 50 dma crossed below the 200 dma. A first step to recovery then was SIL/Silver breaking above its declining 50 dma again; we needed silver regaining $18 to achieve this. Remarkably the early Nov and Dec slide of precious metals -with silver back below $17- didn't bring about a collapse of miners. Silver miners proved exceptionally resilient. As silver was nearing $17/Oz again, SIL/Silver remained well above its 200 dma, with the 50 dma having put a golden cross. After some hesitation silver miners again propel higher as the metal kept firming. SIL/silver peaked on Dec 30, 2019.
Canadian Gold and Silver Mining indices
 |
| GMP list based (and capitalization weighed) gold (yellow dots), silver (blue) and equal weight (red) miners indices. Reference 1000 on Nov 19, 2010 (click to enlarge) |
Note that the index calculation always is compensated for composition changes.
How we got so deep into trouble is best illustrated when showing a long term graph of those capitalization weighted miners indices. The revival after late Jan 2016 healed the last leg down of the miner bear market. We briefly topped the May 2013-Oct 2014 trading range.
 |
| Long term graph of the GMP list based (and capitalisation weighed) gold (black), silver (blue) and equal weight (red) miners indices. Reference 1000 on Nov 19, 2010. - Data till Dec 29, 2017 (click to enlarge) |
The silver miners index rose till 1400 in April 2011, peaking three weeks earlier than did the silver price. The silver miners index also posted a higher maximum during both the March 2014 and June to early August recovery than it did in the August 2013 recovery. The gold miners index and the equal weight index did not peak higher at any of the failing 2014-15 recoveries than they did in August 2013. By January 2016 silver miners nearly completely lost their edge relative to gold miners, yet the recovery proved more vigorous. The below long term graph covers over three years: the end of the bear market with miners bottoming by Dec 2015, the 2016 boom-bust over the tedious months early 2018, with miners unable to match gold strengthening. Miner quotes were jittery after gold plunged below $1200. Towards end 2018 gold strengthened to $1280 with miners recovering timidly.
 |
| Mid/Long term graph of the GMP list based (and capitalisation weighed) gold (black), silver (blue) and equal weight (red) miners indices. Reference 1000 on Nov 19, 2010. - Data till Mar 13, 2020 (click to enlarge) |
Performance graph
There is an important performance disparity among the gold and silver miners of the GMP database. Many laggards seem moribund. The median (or middle) miner (with an equal number better and worse) is losing 73%: now more than tripling is needed to break even. The average loss posts at 50.2% as the performance distribution is slanted towards few gains left. Over the past week, average loss deepened over 20%.
 |
GMP Miners sorted by loss to gain since inception on Nov 19, 2010. Click to enlarge
|
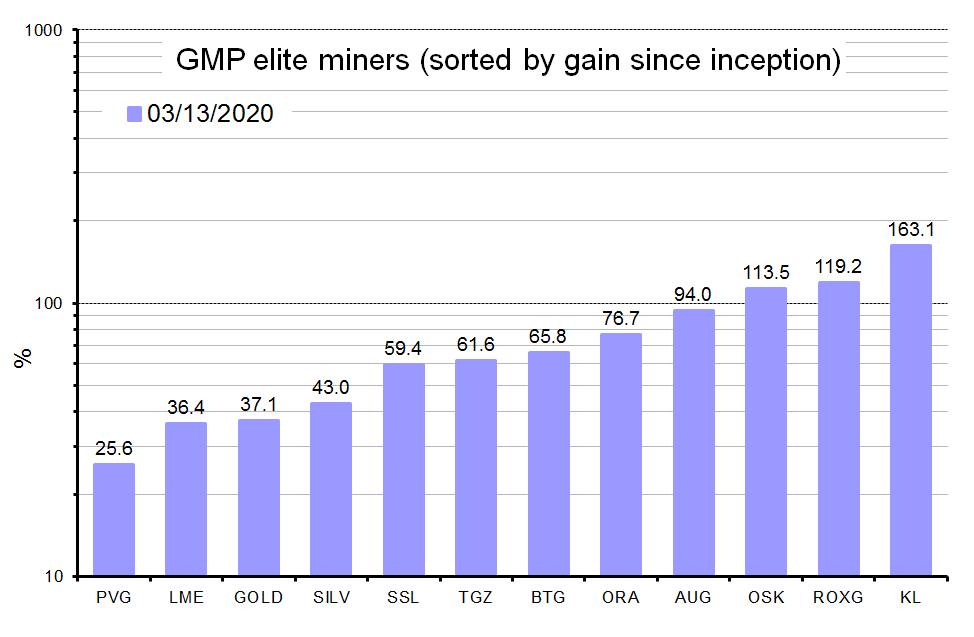 |
| GMP elite miners, sorted by gain since starting observations in Nov 2010 using a logarithmic view with minor ticks 10% apart in the bottom decade and 100% apart in the next decade - Click to enlarge |
A more detailed analysis including list composition changes, is found on the page "miners performance". The miners included in the database are classified in five performance quintiles. This allows evaluating how individual miners went with the herd or against the grid.
The contributor driven explorer and (junior) mining spreadsheet
Pooling efforts with any cooperative peers out there, I started the “contributor driven explorer and junior mining spreadsheet” end 2011. The idea is to get a selection of explorers, junior or mid-tier producers of gold and/or silver. This spreadsheet is updated weekly. Sector benchmarks (ETF's) were added since the very start.
Related blog articles
Several more detailed articles focusing on the longer term have been published. These are using the same approach as this blog page and still are a good read to grasp the historic perspective:- Miners relative to precious metals: a tactical approach; (July 2, 2012)
- Miners relative to precious metals: An update on 2012; (Jan 13, 2013)
- Anatomy of a gold miner bear market (Dec 30, 2013)
- Three year slide of precious metal miners (Dec 31, 2014)
- Gold miner bear market starting its fifth year (Jan 3, 2016)
- Precious metal miners relative to metal prices (Dec 31, 2016)
- Precious metal mining in 2018: a dark cloud with a silver lining and 2019 outlook (29 Dec 2018)
- Gold Miner Pulse 2019 (half-year update) (Jul 1, 2019)
- Precious metal and miner 2019 overview and outlook for 2020. (Dec 31, 2019)
Prospect Generator Thanks for a very interesting blog. What else may I get that kind of info written in such a perfect approach? I’ve a undertaking that I am simply now operating on, and I have been at the look out for such info.
ReplyDelete