Are precious metals and miners on a protracted slide and was the January peak a rosy dream ending in a rude awakening? Or was this rude awakening the inevitable consequence of a speculative bubble leading to a parabolic price rise?
Gold over the last 12 months
Actually only the narrative is different. One year ago, gold was about to break out of its trading range roughly between $3000 and $3400, with only miner excursions beyond these boundaries. Half a year after the peak and the secondary rallies that followed, a new trading range seems to establish itself. Gold broke below $4000/Oz on several occasions, but these price excursions seem to trigger demand, rather than to exacerbate more selling. Yet that demand is price sensitive. Rallies above $4300 quickly run out of steam.
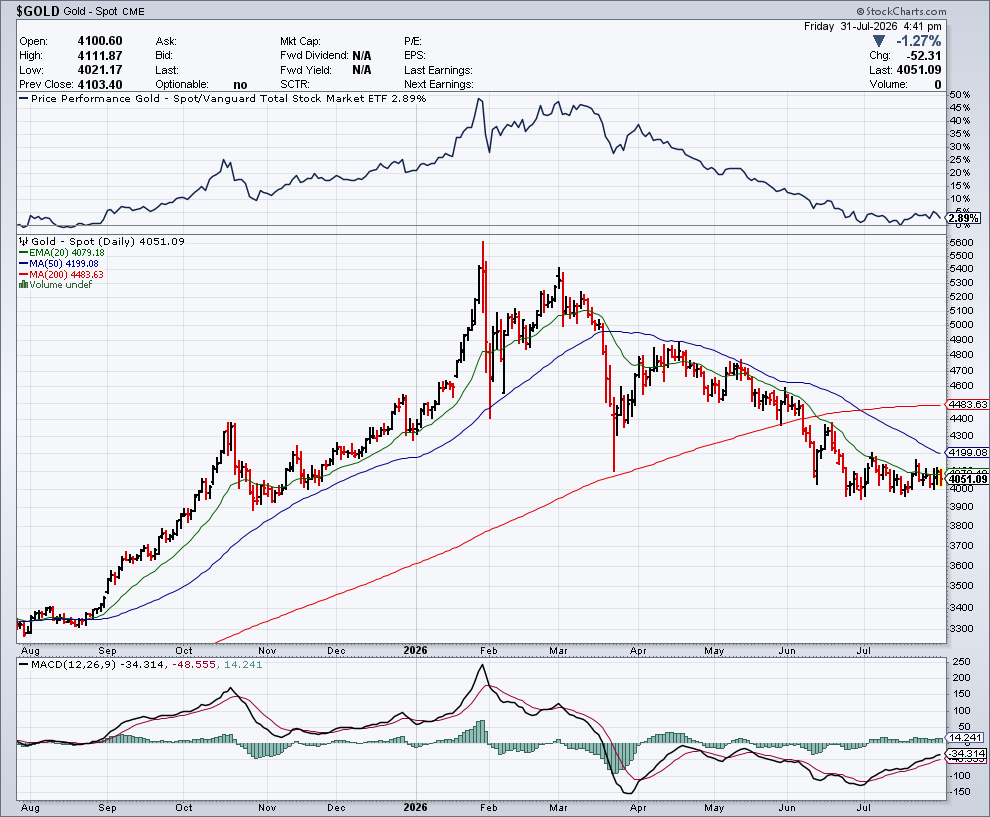 |
| Daily gold fix price at the NYMEX in USD/Oz over last 12 months |
Central Bank buying has been depicted as the main driver for the gold rally, whereas it is rather a support preventing the gold price of sliding ever deeper. And whereas de-dollarization is real, it is more gradual than depicted among the doomsday activists.
It has taken several months with high volatility before a consolidation range was finally established, close to the end of the second quarter. The first quarter of 2026 has been the most volatile, while during the second quarter a downtrend set in. It was the worst quarter for gold since the flash crash early 2020 at the start of the pandemic. Yet the current market rather reminds the price stagnation after the failed gold break-out of 2016; only the price level is fundamentally different.
Mining stocks index (HUI)
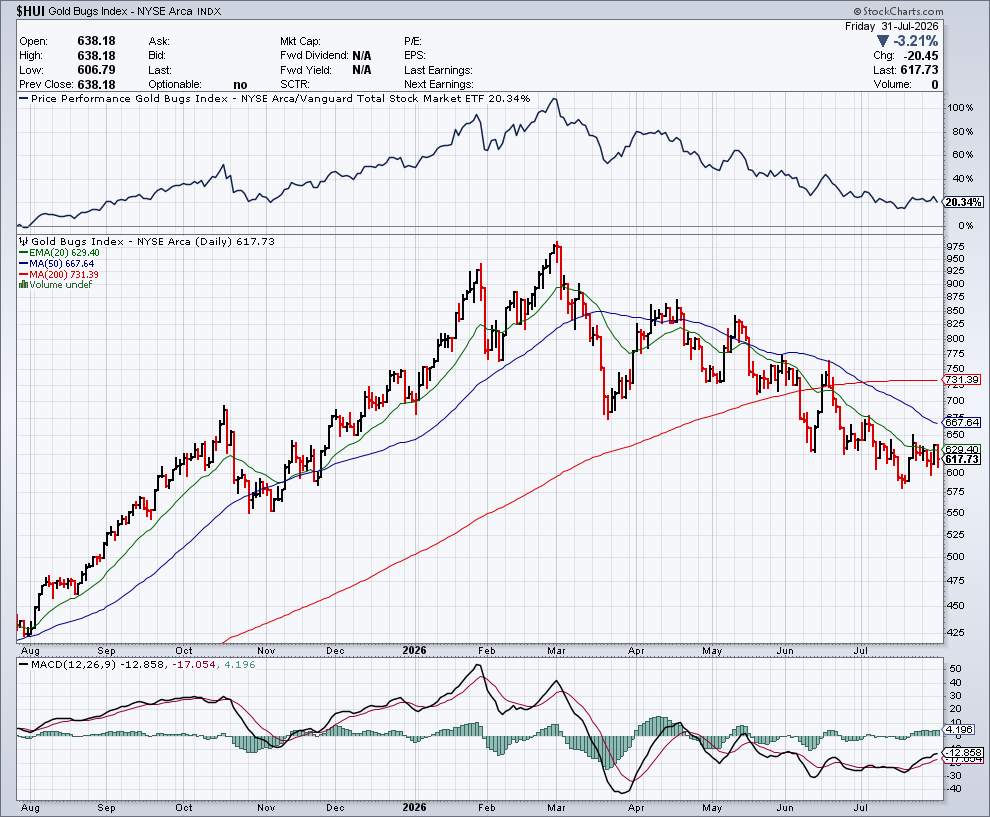 |
| Daily closing values of the HUI gold mining index over last 12 months |
Mining stocks have provided the expected leverage on the gold price over the past year. Though the price slide since the January peak is higher percentage-wise, we nevertheless hold on to a significant gain since early August 2025. Gold having gained about $800/Oz on balance from the 2025 trading range to the current one, does indeed translate to a significant gain for the miners. We have seen worse on several occasions over the past decades.
HUI to Gold ratio
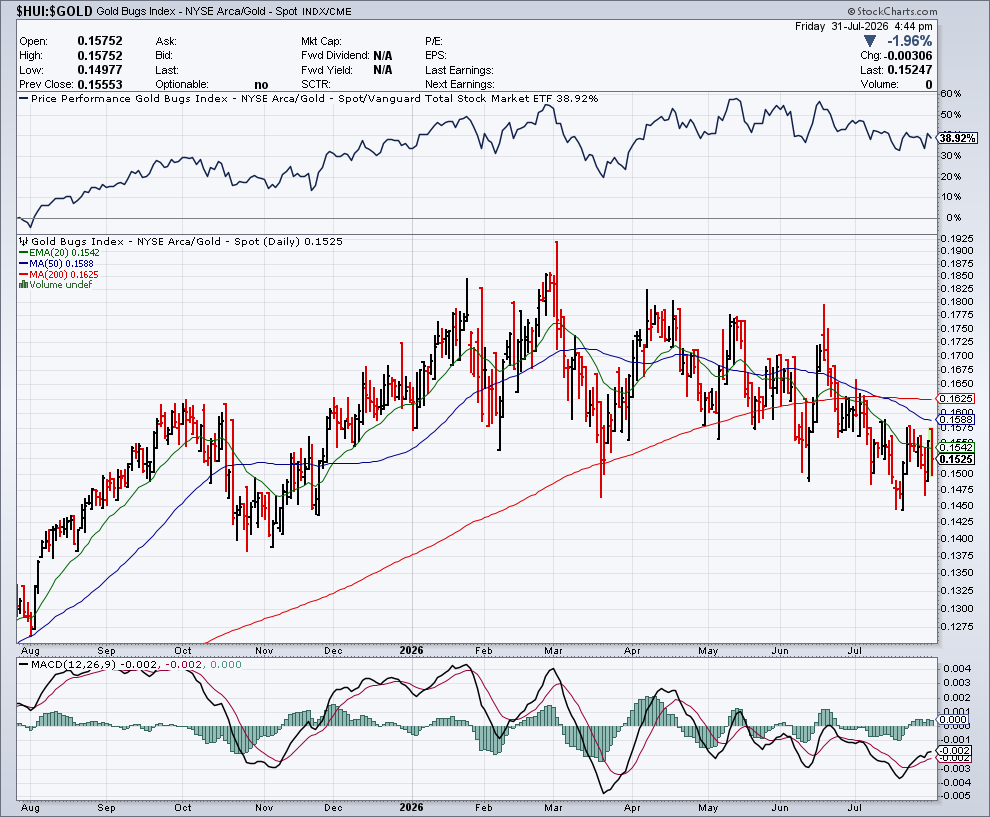 |
| Daily observations of theHUI to Gold ratio over last 12 months |


No comments:
Post a Comment