This subject has been treated in depth on multiple occasions on this blog channel. The current article is merely an extension illustrating the trend over the last 12 months.
Three graphs are presented, each one ending on May 29, the last trading day of this month. First we show the metal, its uptrend topping out and consolidation over the last few months. Next an aggregaed measure of precious metal mining equity is shown, as represented by the HUI index, which is a basket of unhedged gold and/or silver miners. "Unhedged" essentially means that the volume weighed length of their hedging positions is less than 12 months of production.
Note: Hedging positions can be both an asset or a liability, but the latter is most often the case. By 'hedging' a miner is fixing part of its turnover in dollars eliminating thereby both the downward risk of a falling gold price as the upward potential of any gold rally.
Finally we show the ratio of the HUI relative to gold.
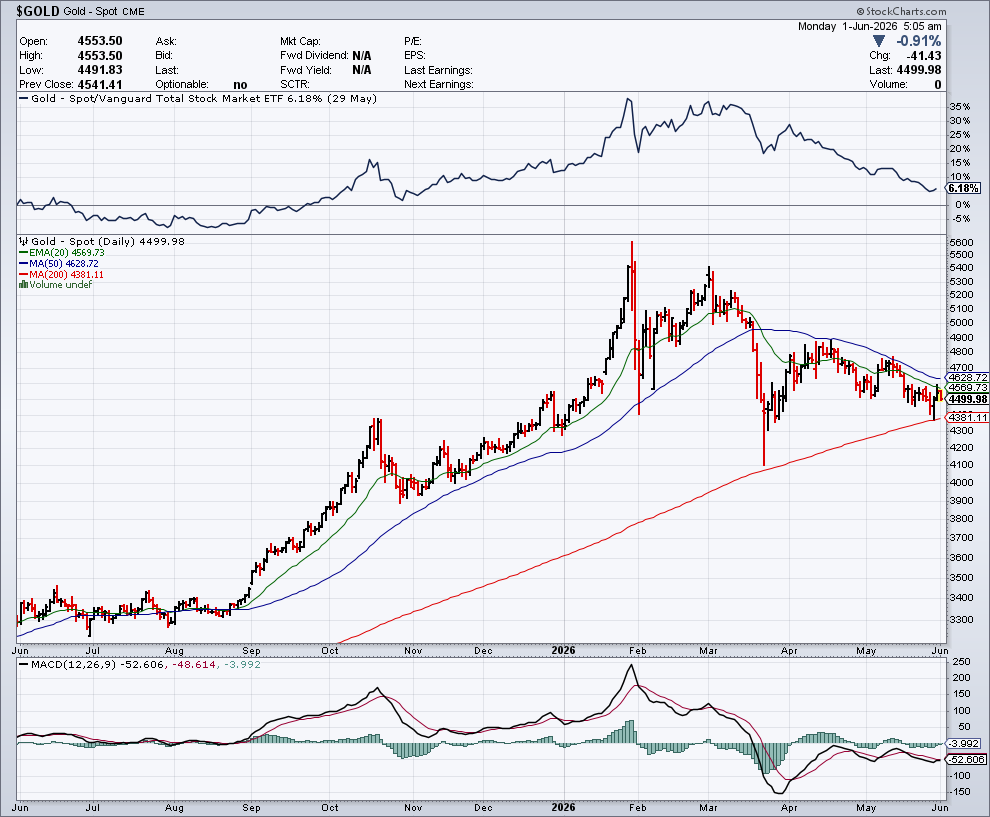 |
| Daily gold fix price at the NYMEX in USD/Oz over last 12 months |
Gold trend
The gold price chart, while generally known, is examined here in its timing details. We start off with a consolidation pattern, which seems quite flat in retrospect, but really wasn't. Mainly while remaining range-bound, fluctuations of a few hundreds of dollars don't seem important any longer with gold having surpassed $5400 but were considered primordial at a time when $3500 meant breaking out to a fresh all time high, while $3000 meant the breakdown of the gold bull market. The $300 fluctuation amplitude seems contained on a linear scale, but 10% was as meaningful as it is now. By late August, the consolidation was over and gold started rising, first breaking out, followed by a linear ascent, leading to a parabolic rise by mid October. Parabolic rises always end, but not necessarily with a plunge wiping away all gains of the previous rally. Gold fell back into an uptrend leading to a Christmas rally, only briefly interrupted till after New Year 2026. The parabolic rise ended on Jan 29 after the intraday high on the Shanghai gold exchange was followed by a meaningful slide in London and the US. The second price excursion above $5000/Oz started end February and lasted for two trading weeks into March. Whereas the previous ATH was not broken, the price excursion above $5000 lasted much longer than the parabolic rise end January 2026. However the breakdown also was more violent. Gold nearly touched its rising 200 dma, but any plunge below $4380 was an intra-day anomaly. Gold remained more or less range-bound during April and May 2026. Fluctuations look larger on a linear scale, but more or less remain within a 10% range as they did in the early summer of 2025.
 |
| Daily gold fix price at the NYMEX in USD/Oz over last 12 months |
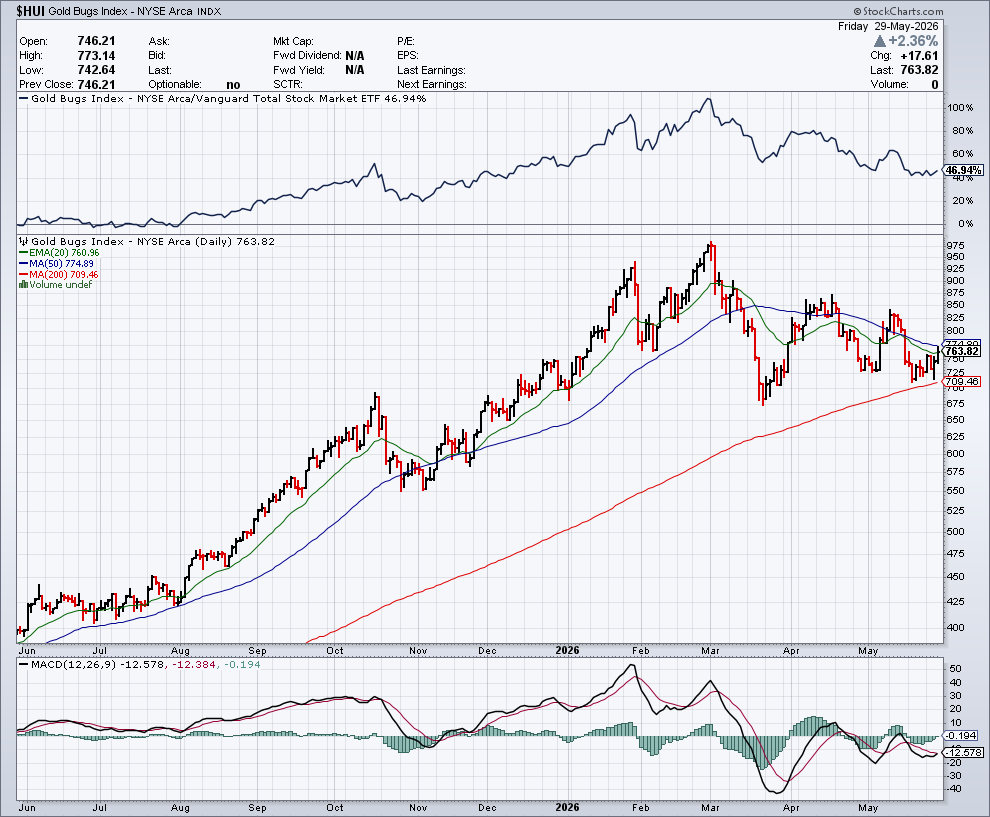
What happened to gold mining equity?
The graph range from 400 to 975 already tells a story: mining equity rose more from its late May 2025 base to the peak than gold bullion did. This is a clear trend breach of what had been observed repeatedly over more than a decade. There have been some periods when the HUI followed a regression pattern (1) relative to gold, leveraging both up and down. But any such regularity ended in the same way: gold equity started lagging the metal, much to the despair of long time mining investors. Bullish analysts lost all credibility. Only some strategic investors with long term view were candidly or even overtly deploying capital. Yet the kind of repricing of gold from below $2000 less than three years ago to around $4500 now, gives rise to a meaningful margin expansion, turning despised assets into coveted ones. Although mining equity suffered a significant loss since the second gold peak early March, we did not witness any 'capitulation selling' the way it used to be before.
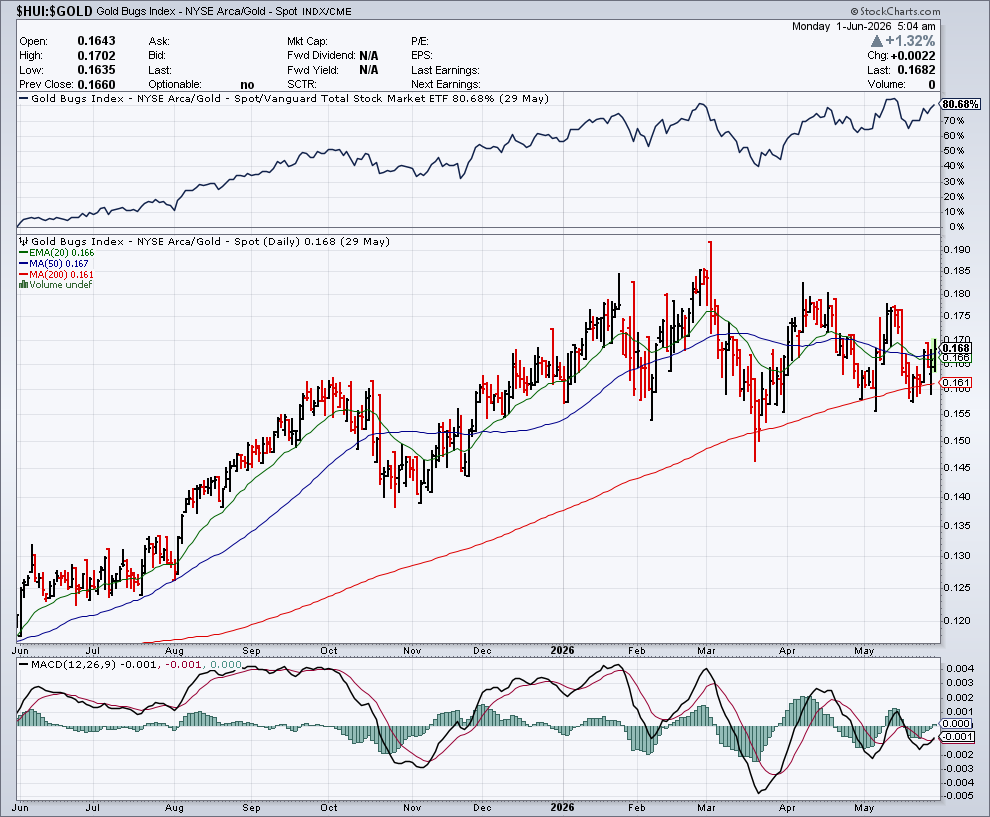
A look at the HUI/Gold ratio
This ratio 'compensates' mining equity for the price of bullion and therefore should be much more range bound.
 |
| Daily gold fix price at the NYMEX in USD/Oz over last 12 months |
The observed range between 0.12 and 0.19 is indeed more confined. Yet on several occasions we notice that the HUI/Gold ratio has been anticipating the gold trend. Mining equity started firming significantly early August 2025 while the gold uptrend was to start only by the end of that month. HUI/Gold started weakening early October 2025 whereas the parabolic gold rise was to end only on Oct 20.
There was more hesitation mid January 2026 before the yellow metal was to spike to its all time high. Furhermore, mining equity firmed significantly towards end February, reaching a new all time high, above the January peak, as shown by the ratio. Yet the loss into March was significant. Mining equity started weakening before the mid March gold plunge. We have seen a recovery into April, but a much more sideways trend ever since. The present consolidation pattern seems to be on a downward sloping trajectory, yet it remains uncertain how this is going to play out.
(1) See the 'HUI to Gold regression' keyword label below with articles going as far back as 2015.
No comments:
Post a Comment