The HUI Gold Miners index has dipped several times over the last two months. The recovery after the last dip on Nov 3 proved to be sustainable.
The 50 dma bottomed almost exactly at that date. The ongoing recovery can however not yet avoid miners to remain in the red over 2022. As of this afternoon, the HUI still is down close to 15% over the year. The yellow metal is nearing break-even: -3.30% year-to-date as of this afternoon. Gold had been down more than 11% over 2022 by Sep 26 with a COMEX close at $1622.4. On that same date, the HUI index dipped to 175.7. Even in a historic perspective this is exceptionally low. The Yahoo series going back to early June 1996 starts with the HUI at 208.4 for a gold price of $389.7.
HUI graph
 |
| HUI index daily observations year-to-date, click to enlarge |
Whereas gold could deliver as an inflation protection over the long haul, miners failed miserably in providing leverage to the gold price. Leverage to gold may have worked out over certain time stretches. In between miners have been losing ground relative to gold. Some previous articles illustrated this once more: Miners index (HUI) to gold regression impaired.
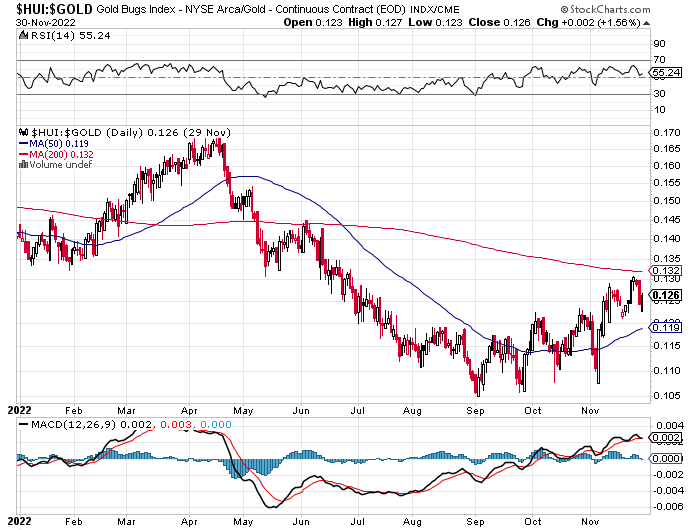
It doesn't surprise that HUI/Gold ratio has been weakening over 2022. HUI/Gold dipped to its lowest level (0.10635) on Sep 2. Any subsequent recovery was soon reverted with yet another dip. The 50 dma of HUI/Gold bottomed mid October. The tendency has been up since early Nov. However more work needs to be done to bring it back to where we started the year.
HUI/Gold graph
 |
| HUI index relative to Gold daily observations year-to-date, click to enlarge |
Despair is over, technical indicators seem to point up, but the recovery still is frail. Miners have had a few good months from February to April, but the second and third quarter brought the worst slide we have experienced since 2013Q2-Q3.
Global X Silver Miners ETF (SIL)
 |
| Global-X Silver Miners ETF, SIL. Daily observations year-to-date. Click to enlarge |
Silver miners did not enjoy any significant rally over Feb-Apr, the way gold miners did. The slide from Apr to Sep-Oct was however not less severe. Both have been down between 30% and 40% year to date. The recovery since the trough is also comparable.
Global X Silver Miners ETF (SIL) relative to silver bullion
SIL/Silver graph
 |
| Global-X Silver Miners ETF, SIL relative to silver bullion; Daily observations year-to-date. Click to enlarge |
Although silver miners also lose ground relative to silver bullion, the SIL/Silver slide is less pronounced. It looks more like a gradual grinding lower. The slide of the metal (still about 9% year-to-date) contributes more to the slide of silver miners.
Canadian Gold and Silver Mining indices
How gold miners are performing is shown by the capitalization weighed gold miners index of stocks included in the Gold Miner Pulse database (yellow diamond symbols). Note that most quotes are in CAD, which has been fluctuating to the USD. The blue graph shows the GMP silver miners index. The long term depreciation of the loonie mitigated the miner loss during gold miner bear market.
The silver mining index has been the first to break above parity, despite silver lagging gold since we started over 10 years ago. They recovered from their winter 2021/22 downturn, but slid back.
 |
| GMP list based (and capitalization weighed) gold (yellow dots), silver (blue) and equal weight (red) miners indices. Reference 1000 on Nov 19, 2010 (click to enlarge) |
Note that the index calculation always is compensated for composition changes.
Performance graph
The performance disparity among the gold and silver miners of the GMP database is striking. Several laggards seem moribund. The median (or middle) miner (with an equal number better and worse) is now losing 58.4%: almost a triple is needed before breaking even. The average has slid into the red since a couple of months still posting a 4.6% loss. The performance distribution is slanted towards the high gains.
 |
| GMP Miners sorted by loss to gain since inception on Nov 19, 2010. Note that the top miners are left out to avoid excessive scale expansion Click to enlarge |
There are 16 miners/explorers losing 90% or more, with 5 thereof down over 95%. At the opposite side 21 miners are still quoting above their Nov 2010 mark, now led by Filo Mining; 14 stocks have doubled. The top 12 miners are omitted in the above graph to avoid excessive scale expansion, but you find the top-14 in full detail below:
 |
| GMP elite miners, sorted by gain since starting observations in Nov 2010 (logarithmic view with ticks 100% apart. Click to enlarge |
A more detailed analysis including list composition changes, is found on the page "miners performance". The miners included in the database are classified in five performance quintiles. This allows evaluating how individual miners went with the herd or against the grid.
Related blog articles
During 2011-15 and even over the long haul, the relative performance of mining majors to the precious metals they produce was disappointing for major gold miners, even while the metals were in a solid uptrend. See: Gold miners: three decades for naught or Decades of underperformance
No comments:
Post a Comment