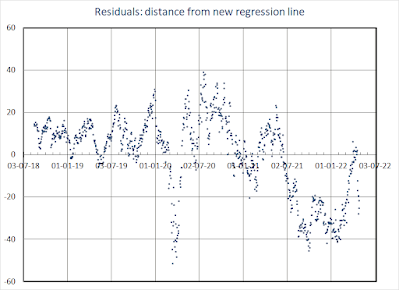
The linear regression between the HUI miners index and the gold price which was valid since Aug 2018, has come under severe strain since last summer. Permanently negative residuals are a clear statistical indication that the linear relationship is seriously impaired.
Regression update
After almost one year, the HUI has come close to regaining the regression line, however without reaching it. Including all data points from recent months into the regression calculation has also come at a price: the linear correlation coefficient slid from 0.95 to 0.91.
 |
| HUI to Gold regression from 2012 till now |
The high gold price end of the regression line is pressed down, yielding an even lower slope than previously established.
Earlier studies on the HUI vs Gold regression can be easily be found using the 'linear regression' or 'HUI to Gold regression' keyword below the article. Regressions are found to fail in the same way: miners are unable to catch up with a rising gold price. Hence they don't deliver on the 'leverage' myth.
Synoptic view
The synoptic view graph has the original linear regression relationship taken on board by matching the second vertical axis. Extending it to the present, it now looks like this:
 |
| Synoptic view of Gold (red, left axis) and the HUI (blue, right axis) |
The red graph is both the gold price when read on the left axis, as the regression value of the HUI when read on the right axis. Since the summer of 2021, the real HUI value (blue graph) is permanently below the red graph. It briefly became close earlier this month, when gold tried one last attempt to reach $2000/Oz. As it failed, the HUI miners index slid a lot more than did the yellow metal.
Residuals
Even with a lower regression line slope than previously established, residuals barely reached the revised break-even earlier this month.
 |
| Revised regression residuals since August 2018 |
Historic long-term graph
 |
| Gold miners index (HUI) (right axis, blue) and gold price (left axis, red) |
The above graph shows the HUI and gold over more than a quarter century, going back to the 1990's when gold was sliding to its bear market bottom of $258.2 in July 1999. The HUI index bottomed at 36 in Nov 2000 with gold at $265/Oz. While the HUI miners index peaked at 635 in Sep 2011, it would take to Aug 2020 for gold to peak at $2063/oz with the HUI index then at 362.4.
Discussion: hawkish FED and mining cost inflation
As often (nearly always) is the case, the FED has been late to react on the rise of inflation. The 'transitory inflation' myth lost its credibility since last year. 'Supply chain issues' were then invoked to justify prolonged inflationary pressures. Quantitative easing was scaled back more rapidly than planned and a first 25 bp rate hike followed in March.
One more recurring policy is 'FED-speak'. The FED is very vocal on its intention to continue raising interest rates, possibly with 50 bp increments. Whereas they cannot alter supply constraints, aggravated by the Ukraine war, raising interest rates may impact demand, both directly (more expensive credit) as indirectly (sliding stock and bond markets reduce financial wealth).
If high inflation proves more sticky than anticipated, precious metals may uphold better. If the FED succeeds in calming down the price surge, long term inflation expectations may remain moderate. In this case expectations for the real interest rate would no longer be negative. That would be a severe headwind for precious metals.
Mining cost inflation is what makes miners more vulnerable now. Open pit miners need lots of fuel to operate their monster trucks. Milling of high volumes of low grade ore is also energy intensive. Underground miners need more steel to maintain their network of shafts and galleries. Mining ore requires a lot of electricity. Add rising labor costs and higher investment budgets to sustain mine production and you get a more complete picture.
A weaker gold price in itself does not necessarily push miners deeper below their regression line. The regression relationship already has the dominant leverage factor on-board. However inflation has an upward effect on the break-even value of gold-mining. The linear regression feels the effect on the intercept value, which most likely is creeping up.
No comments:
Post a Comment