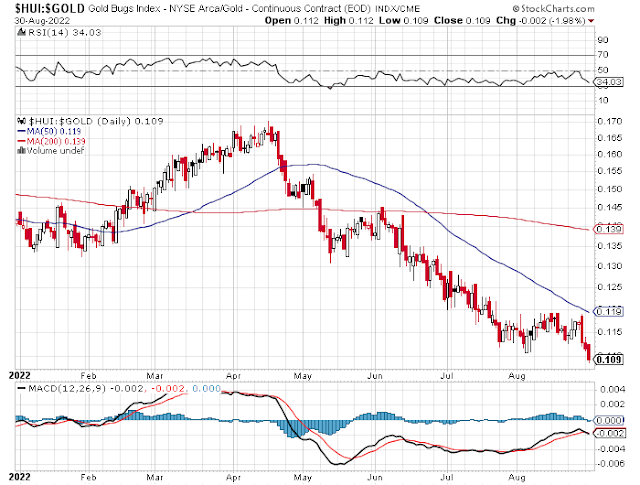
Never an autumn precious metals and miner rally has been more improbable than in 2022. The July miners crash was only the first stage. The month ended with miners barely following the gold recovery lasting till August 12. The sentiment for precious metals turned sour again, especially last few days as PR's from Jackson Hole don't reveal any softening of the pace of FED rate increases. Those seem now echoed by a similar, though much delayed, stance taken by the ECB.
We had barely one Comex close above $1800/Oz. The rally failed on Aug 15 and gold is on a downward slope again. The USD rally, driving the Euro below parity for the first time since 2000 underpinned the gold slump. The gold year-to-date graph adds its August chapter:
 |
| Gold in USD/Oz, Comex close - Continuous contracts, daily observations year-to-date. |
The 200 dma has flattened as the effect of the February - March rally (upon the invasion of the Ukraine) has worn off. the shorter 50 dma has been sliding since the end of May. Gold once more posts below both moving averages. This raises no hope for any decent autumn rally.
Miners
 |
| HUI gold miner index, 2022 year-to-date |
 |
| HUI index relative to Gold year-to-date, click to enlarge |
Individual miners
How individual miners are doing since initiating the follow up in Nov 2010 (now almost 12 years ago) is monitored on the Miners' Performance page. The 'break even level' crept up into the top quintile again, meaning that less than 20% of the miners are still above their Nov 2010 level, even though gold is well above its 1342$/Oz starting level from back then. This is illustrative of the fact that miners are poor investment vehicles, unable to warrant any of the desired 'optionality' at rising gold prices over the long haul.
No comments:
Post a Comment