Gold investors may not like this, but the main Gold & Silver miners index, that has been around for a while, exhibits decades of underperformance.
The gold miners index most referenced now is the "Unhedged Gold Bugs index" with ticker ^HUI. You can find data on Yahoo going back to 1996 for this index. However the Philadelphia Gold & Silver Miners index (ticker ^XAU) goes back way before this. Yahoo posts XAU data from 1983 onwards, but the index may be older than that. One main difference between the two is the inclusion of Freeport McMoran in the Philadelphia Gold & Silver Miners index, with a heavy weight of about 13%.
Recently I've focussed on how the HUI does outperform bullion during the gold rallies, but still fails to catch up since it fell into the abyss back in October 2008. See: Did you say leverage?
As for now I will focus on the Philadelphia Gold & Silver Miners index, abbreviated XAU henceforth.
End of the 20 year Gold Bear Market and Gold Bull years until now
Following graph shows the XAU and gold bullion in USD. Left and right scales differ by a factor of five, showing the XAU at 200 and gold at $1000/oz at the same level.
Before the turn of the century, the XAU quoted over one fifth of the (low) price of gold at that time. The gold bear market gradually eroded the miner cash flows and the XAU fell back under the gold curve more often. By summer 2000 this tended to become permanent. But the gold bull market was to start roaring its tail, thereby saving the XAU which almost continuously outperformed the gradual rise of gold in the initial bull phase till December 2003. In the second bull phase 2004-2007, bullion climbs at a faster pace. The XAU however starts facing more severe corrections at any minor hesitation of the gold price. Occasionally the XAU drops below 20% of bullion. In the October 2008 crash, XAU falls off a cliff, while gold faces a major correction, as troubled financials sell whatever to meet immediate liquidity needs. In the aftermath the XAU has risen spectacularly throughout 2009, yet it never recovered to the prior ratio at 20% of bullion. We get a similar conclusion as was made for the HUI, which fails to regain half of the gold price.
Over the 'medium term': since the highs of March 2008, the XAU came near that level by December 2009 and made a new high in the autumn rally of 2010. The recent slide brought us back to the old March 2008 top level, when gold peaked at just above $1000/Oz. In spite of a $100 slide, gold is still over 30% higher now!
Last decades of the 20th century: the Gold Bear sneaks in...
For the gold price, I've been using the time series of the World Gold Council which contains daily obeservations since January 1998 and monthly averages from 1971 onwards. Next graph shows the XAU (in red) from December 1983 till Januray 1998, together with monthly averages of the gold price (blue diamonds).
Now, observe that the scales differ by a factor of four: the left Price of Gold scale running from $200 - $640 and the right XAU scale running from 50 to 160 points. What was the 'yard stick' in the late 20th century? The XAU was often above 25% of the gold price, especially during the rallies. Volatility was high as it always has been: far higher than that of bullion. So, "leverage of the miners to variations of the gold price" has always been the main rule. Yet investors were accustomed to see the XAU at about 25% of the gold price and considerably above that level during gold rallies. Our contemporary investors must face the fact that this paradigm is long gone. Instead of 1:4, they need to adapt to a 1:7 rule of thumb. Gold majors have lost over a third of their value relative to gold on the long haul... and who knows what's to come. Vae victis.
What happened is clear when showing a long term graph of the ratio between XAU and gold. The "1:4 golden rule" of the late 20th century is being broken down by the end of the 20 year bear market of gold. The ratio bottoms in autumn 2000. The new gold bull market brings the XAU/Gold ratio back in a trading range from 1:4 to 1:5, with disgressions at either side signalling a selling and buying opportunity respectively. The paradigm breaks down with the financial crises. A new 1:7 (1:6 at best) indicative ratio seems to establish itself as a new golden rule henceforth. Underperformance has consolidated.
Pre-history of gold-mining valuation relative to bullion
Data availability of numeric series limits research to the decades since 1983. When going even further back in time (it is possible), we are confined to using graphs as published. One gold mining index has an over 70-year history: the Barron's Gold Mining Index (BGMI) as shown in next graph.
As for the gold price during the first decades of this graph: the world was on a gold standard, with a 35 USD/oz price tag for gold. Yet American citizens were not allowed to own gold bars since FD Roosevelt prepared for devaluing the USD in 1933. The dollar devaluation turned a 20.67$/oz fully gold convertible dollar until the early 1930's into the $35/oz official gold price valid until repealed by Nixon in 1971. Over this timespan of 38 years, the US recovered from the depression and became the main supplier of the Allied Forces in WW II, joining them in combat after the Pearl Harbour attack in 1941. While Europe, Russia and Japan were devastated by war, the US industry was not affected and made a leap forward in productivity. Establishing the (postwar) Bretton-Woods agreement with fixed exchange rates between a gold linked USD and the currencies of Western Europe was mutually beneficial and was hardly questioned throughout the 1950's. The US maintained a trade surplus and USD reserves were scarce. "As good as gold" was not a hollow phrase 60 years ago.
The US entering in a local conflict between communist and nationalist forces in Vietnam led to the outright Vietnam war, tearing apart American society. War efforts made Federal deficits unavoidable and persistent, spurring inflation and eroding thereby the US trade surplus. Gold had a tendency to rise in price due to the excessive growth of the money supply. However, the gold price remained fixed because of the so-called "London pool" actively interfering with occasional and well timed gold sales of official reserves. Such sales with a simultaneous increase of the amount of currency in circulation, spurred distrust about the gold backed dollar. Mending the effect of a flawed growth of money supply by selling official reserves thereby further reducing the gold backing of the world's reserve currency is indeed counterintuitive.
It was clear for many investors that the gold price was due to rise, following the general price level upwards. Gold mines started rising despite profits staying flat. Expectations drove up valuation. With the BGMI ranging at about 35 in the 1950's, the ratio to gold was 1. The BGMI rising to 200 in early 1968 drove up the ratio to over 5, factoring in a gold price of $200/oz. This gold price level failed to materialize just after the "London Pool" tossed the towel in March 1968, leading to a 'free gold price' for commercial use. Gold mine stocks reacted adversely to the rise of the precious metal.
The Bretton Woods agreement was repealed in 1971, terminating the possibility for central banks of the Bretton Woods countries to obtain gold at the official $35/Oz for excess dollar reserves. The world was on fiat currency by definition. Gold miners started recovering, but it would take a first petrol shock of 1973-74 to send gold and gold mining stocks soaring higher upon rampant inflation. In Gold Stocks versus Bullion, Steve Saville discusses the BGMI to gold ratio over the period since 1960. Hereby a graph from the above article:
Since speculation on the end of a fixed gold price peaked in 1968, the BGMI/Gold ratio was never to reach the same level again: 1968 marks the start of decades of underperformance of gold mining stocks relative to gold bullion. The BGMI/Gold ratio showed a lower secondary peak in 1974 as the gold price attained about $180/oz. However when gold soared in January 1980 to mark an all time high which was to remain for nearly three decades, the BGMI/Gold ratio fell to a low. Investors were factoring in Gold was never to hold on to this price level. A normal and positive correlation sets in: during the 1980's with troughs in late spring 1982 when gold makes a low at a monthly average of 315$/oz and a peak about a year later when gold averages $437 in May 1983. This is about where I headed off with the analysis of the XAU index.
Whereas the gold price is a main drive for gold mine stock prices, there is an awful lot more to it. Investor sentiment has driven the different "gold miners index to gold" ratios to extreme and unsustainable levels.
Updates on 'Gold mining stocks relative to gold' can be found on the gold miner pulse page on this blog.
Further reading
This subject has been studied before, mostly focused on the short to intermediate term:
The gold miners index most referenced now is the "Unhedged Gold Bugs index" with ticker ^HUI. You can find data on Yahoo going back to 1996 for this index. However the Philadelphia Gold & Silver Miners index (ticker ^XAU) goes back way before this. Yahoo posts XAU data from 1983 onwards, but the index may be older than that. One main difference between the two is the inclusion of Freeport McMoran in the Philadelphia Gold & Silver Miners index, with a heavy weight of about 13%.
Recently I've focussed on how the HUI does outperform bullion during the gold rallies, but still fails to catch up since it fell into the abyss back in October 2008. See: Did you say leverage?
As for now I will focus on the Philadelphia Gold & Silver Miners index, abbreviated XAU henceforth.
End of the 20 year Gold Bear Market and Gold Bull years until now
Following graph shows the XAU and gold bullion in USD. Left and right scales differ by a factor of five, showing the XAU at 200 and gold at $1000/oz at the same level.
 |
| Gold (in blue on the left scale) and XAU (in red on the right scale) since January 1998 |
Over the 'medium term': since the highs of March 2008, the XAU came near that level by December 2009 and made a new high in the autumn rally of 2010. The recent slide brought us back to the old March 2008 top level, when gold peaked at just above $1000/Oz. In spite of a $100 slide, gold is still over 30% higher now!
Last decades of the 20th century: the Gold Bear sneaks in...
For the gold price, I've been using the time series of the World Gold Council which contains daily obeservations since January 1998 and monthly averages from 1971 onwards. Next graph shows the XAU (in red) from December 1983 till Januray 1998, together with monthly averages of the gold price (blue diamonds).
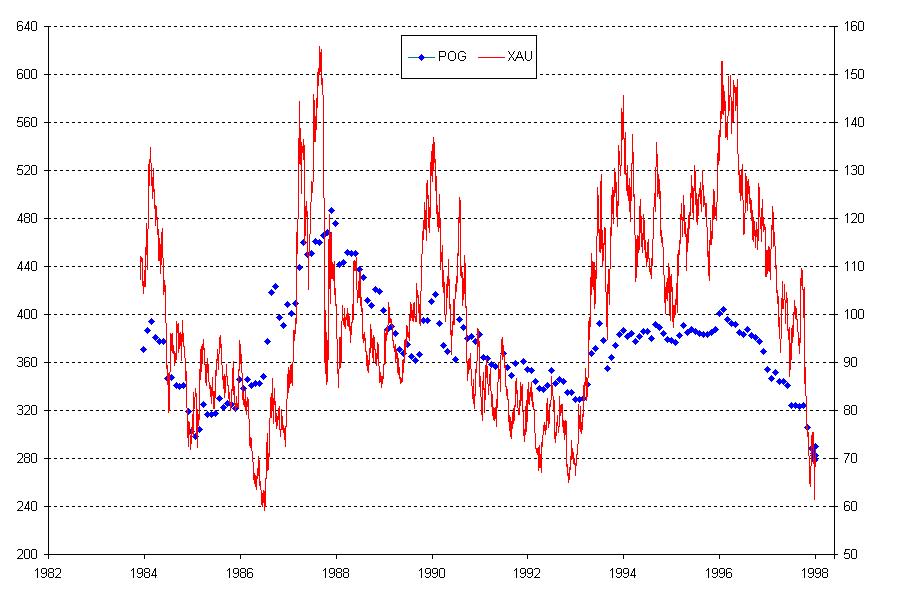 |
| Gold price (blue diamonds on left scale) and XAU (red line on right scale) |
 |
| Long term XAU to Gold ratio (January 1998 till end January 2011) |
Pre-history of gold-mining valuation relative to bullion
Data availability of numeric series limits research to the decades since 1983. When going even further back in time (it is possible), we are confined to using graphs as published. One gold mining index has an over 70-year history: the Barron's Gold Mining Index (BGMI) as shown in next graph.
 |
| BGMI since 1939 to the present - logarithmic axis (click to enlarge) |
The US entering in a local conflict between communist and nationalist forces in Vietnam led to the outright Vietnam war, tearing apart American society. War efforts made Federal deficits unavoidable and persistent, spurring inflation and eroding thereby the US trade surplus. Gold had a tendency to rise in price due to the excessive growth of the money supply. However, the gold price remained fixed because of the so-called "London pool" actively interfering with occasional and well timed gold sales of official reserves. Such sales with a simultaneous increase of the amount of currency in circulation, spurred distrust about the gold backed dollar. Mending the effect of a flawed growth of money supply by selling official reserves thereby further reducing the gold backing of the world's reserve currency is indeed counterintuitive.
It was clear for many investors that the gold price was due to rise, following the general price level upwards. Gold mines started rising despite profits staying flat. Expectations drove up valuation. With the BGMI ranging at about 35 in the 1950's, the ratio to gold was 1. The BGMI rising to 200 in early 1968 drove up the ratio to over 5, factoring in a gold price of $200/oz. This gold price level failed to materialize just after the "London Pool" tossed the towel in March 1968, leading to a 'free gold price' for commercial use. Gold mine stocks reacted adversely to the rise of the precious metal.
The Bretton Woods agreement was repealed in 1971, terminating the possibility for central banks of the Bretton Woods countries to obtain gold at the official $35/Oz for excess dollar reserves. The world was on fiat currency by definition. Gold miners started recovering, but it would take a first petrol shock of 1973-74 to send gold and gold mining stocks soaring higher upon rampant inflation. In Gold Stocks versus Bullion, Steve Saville discusses the BGMI to gold ratio over the period since 1960. Hereby a graph from the above article:
 |
| BGMI to gold ratio over five decades. |
Whereas the gold price is a main drive for gold mine stock prices, there is an awful lot more to it. Investor sentiment has driven the different "gold miners index to gold" ratios to extreme and unsustainable levels.
Updates on 'Gold mining stocks relative to gold' can be found on the gold miner pulse page on this blog.
Further reading
This subject has been studied before, mostly focused on the short to intermediate term:
1. Gold Stock Recovery (2009)
2. HUI Leverage to Gold 4 (2008)
3. HUI/Gold Ratio Trends 2 (2007)
4. HUI/Gold Ratio Trends (2007)
5. HUI Leverage to Gold 3 (2006)
6. HUI and SPX Pullbacks (2009)
7. SPX Driving Gold (2009)
8. Gold and the SPX (2009)
9. Dollar-Driven Gold Plunge (2008)
2. HUI Leverage to Gold 4 (2008)
3. HUI/Gold Ratio Trends 2 (2007)
4. HUI/Gold Ratio Trends (2007)
5. HUI Leverage to Gold 3 (2006)
6. HUI and SPX Pullbacks (2009)
7. SPX Driving Gold (2009)
8. Gold and the SPX (2009)
9. Dollar-Driven Gold Plunge (2008)
10. Goudmijnen, een turbo op de goudprijs? (Gwyde Feb 2010, in Dutch)
11. Gold Stock Valuations (Adam Hamilton, May 2010)
12. Bullish HUI technicals 4 (Adam Hamilton, Feb 2010)
13. Gold Stocks Still Cheap 2 (Adam Hamilton, Dec 2010)
14. Did you say leverage ? (Gwyde, January 2011)
15. Gold stocks versus Bullion -Steve Saville (Feb 2010), including BGMI long term data.
16: Barron's Gold Mining Index
17: The Day the World Changed - M. Lundeen (2006), discussion on the London Gold Pool and BGMI long term data.
17: The Day the World Changed - M. Lundeen (2006), discussion on the London Gold Pool and BGMI long term data.
No comments:
Post a Comment