Whenever interviews of expert mining investors or seasoned CEO's of gold mining enterprises massively emphasize the brilliant outlook for the industry for years to come, you can almost bet on it a correction is about to follow.
It has not been different on this very occasion. The few major institutional investors in gold miners take advantage of the bullish sentiment to unload part of their holdings to small investors, still eager to pick some grains of the rally.
The main result is that many of the large cap miners start lagging the yellow metal as it oscillates up and down its current trading range. The main indexes of gold miners then level off or start weakening relative to gold.
 |
| HUI gold mining index relative to gold, daily observations over 6 months (click to enlarge) |
After the spectacular recovery since the Corona dip, HUI/Gold peaked shortly after mid-May. Investors have not been rewarded for holding on to their miners last few weeks.
However this is not a sufficient proof of what I've been claiming in the first place. The HUI/Gold ratio leveling off and weakening only points to market participants, whether institutional or small individual investors inclined to take profits. Large institutional investors prefer large cap mining stocks that have the market depth necessary to buy or sell without disturbing the price excessively. For small speculators with some thousands to spend, this is less an issue. They more often turn to junior miners. If such is the case, you would expect GDXJ to outperform GDX over the last few weeks, while during or immediately after the Corona dip, that may have been different.
This is what the GDXJ:GDX ratio looks like over last few months:
 |
| GDXJ : GDX ratio, daily observations over 6 months. |
The ratio indeed started weakening leading to and after the Corona dip. During the plunge the ratio itself has been extremely volatile. Most importantly: it has indeed been recovering since mid-May, eventually reaching its 200 dma early June. The stock price erosion was indeed less pronounced for the mid cap miners from the GDXJ than for the large caps in GDX.
"Performance disparity compression"
Beyond this aggregated image there even is more detailed evidence. Not only have large cap miners lagged many mid cap and junior miners lately, even among the 'high flyers', the best of class mid-cap and junior miners, the decline has been remarkable, leaving mainly their less fortunate peers to reap some profit. This translates as a performance disparity compression. With few exceptions, better and larger miners suffer losses while recent advances are mainly shared among the less fortunate mining companies which previously had incurred stiff losses.
In order to demonstrate this, I like to refer to the Miners' performance page. Below you find the main content of the June 12 update. For the cumulative list of changes to the database due to mergers, acquisitions, delistings or bankruptcies, you can check the above link.
Reference date
Miner performance calculated is relative to the start of the calculation of the GMP based gold miners and silver miners index on Nov 19, 2010. For your information: gold closed at US$1342/oz and silver at US$27.07/oz on that day.
Today's statistics
Today the median loss for the miners in the database stands at 44.24%, while the average loss is 12.02%. The median is the value observed in the middle of the distribution. The average is higher (less negative) because the distribution is slanted due to the few high gains.
Over the long haul, still 7 miners are down 90% or more with 3 thereof down over 95%.
At the opposite end, 28 miners are up since Nov 2010, led by Kirkland Lake. Eleven miners have doubled.
Exchange rate
Most quotes are in CAD and likewise all performance graphs illustrate the return in CAD.
B2 Gold (BTG), Barrick (GOLD), Hecla Silver (HL), Coeur d'Alène (CDE) , Newmont Mining (NEM) and Wheaton Precious Metals (WPM) quote in USD. Their performance has been compensated for the long term depreciation of the loonie.
Redesign
'Quintile' bar graphs overlap by one miner/explorer. This facilitates visually pinpointing any performance gap. The bottom ranking miner of the higher quintile is repeated at the top of the lower quintile.
'Quintile' bar graphs overlap by one miner/explorer. This facilitates visually pinpointing any performance gap. The bottom ranking miner of the higher quintile is repeated at the top of the lower quintile.
Latest / Expected list change
Zjiin Mining is to acquire Guyana Goldfields (GUY.TO) creating a diversified precious metals producer as announced on Jun 12.
Graphs section
Individual miner performance since Nov 19, 2010. Miners are identified by their TSX trading symbols.
Click any of the graphs to view them at true size
 | |
|
 | |
|
Back on May 8, the scale of the top quintile extended to 400. By now it has 'compressed to 350. Not only Kirkland Lake is off worse, as can be checked below:
 | |
|
It is at least illustrative that Roxgold, despite gaining two positions from May 8 to June 12 actually sees its aggregate gain trimmed by a few percentage points.
For your information you find the current graphs for the second to fifth quintiles below:
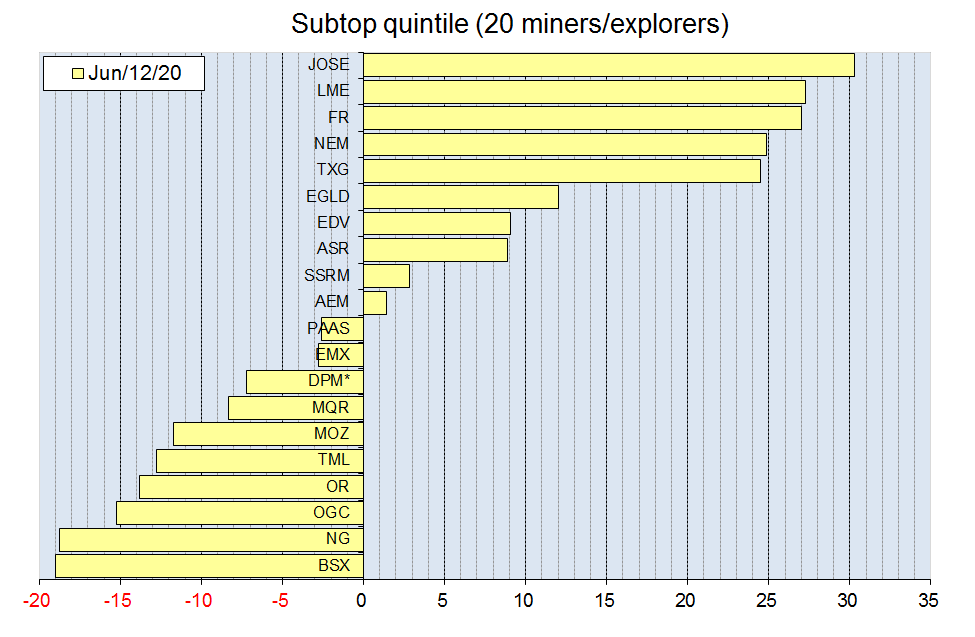 |
| Subtop: the average decline is within this quintile |
 |
| Midrange quintile: by definition you find the median in the middle of this quintile. |
 |
| Laggards quintile |
 |
Investors nightmare: Miners in the lower part of this quintile are down over 90%
The bottom 2 are down over 95%: those really are the basket cases
|
Today's statistics
On an aggregate level, it is remarkable that the median (the 'middle'
miner) now is better off: the median position progressed from a 51.41% loss to
a 44.24% loss. This gain of 7.25% implies a near 15% improvement. However, the
average gain is trimmed 0.86% from an 11.16% loss down to 12.02%. The average
is slanted towards the higher gains. Since the top quintile suffered most, the
average goes against the trend of the median.
Meanwhile, the yellow metal added 1.6% since May 8, while silver rallied
13%. Nevertheless our GMP cap weighted gold miners index is down almost 10%, in
line with the HUI (-8.2%). Remarkably, the cap weighted silver miner’s index
didn't even uphold: -3.7%. This is quite disappointing considering the silver
rally. The 'equal (initial) weight' miners index is off best, nearly breaking
even.
Therefore it also is illustrative that over these five weeks, the number
of advances (50) exceeds that of declines (39) with 5 miners nearly flat
(within 1% from breaking even.)
Over the long haul, still 7 miners are down 90% or more with 3 thereof
down over 95%. At the opposite end, 28 miners are up since Nov 2010,
led by Kirkland Lake. Eleven miners have doubled. On May 8, 29 miners were
up, with ten having doubled but there still were 10 miners down over 90%, with
equally 3 down over 95%. The bottom quintile shows an unusual improvement. The
bullish tide is lifting all boats, but those under sail and leading the race
are currently facing headwinds !
Individual names
It comes at no surprise that the top performers over the last five weeks listen to names such as Guyana Goldfields (GUY), Golden Minerals (AUMN), Mountain Boy Minerals (MTB) and International Tower Hill Mines (ITH). All are quoting on the Toronto Stock Exchange (TSX); Impact Silver (IPT) quoting on the TSXV (Venture exchange) is completing the top-5 list. All of them have been dreadful long term mining picks. Guyana Gold Fields is going to be acquired by Zjiin Mining (after Silvercorp withdrew from the bidding war).
Junior Miner Kirkland Lake and explorer Osisko Mining are among the worst performers. Newmont Mining (NYSE) also sold off. All three of them saw their long term gain trimmed significantly. Furthermore Belo Sun Mining and Novagold are among the laggards last few weeks. Both changed long term gains for losses.
Discussion and conclusion
The lock-down after the Corona outbreak caused a drop in production volume; especially miners with several production sites in Latin America have been heavily impacted. But worldwide production has been halted in those mining sites that have suffered a local outbreak among the staff. It comes at no surprise that underground operations are more at risk than open pit mines. Several miners have revised their 2020 production forecast downwards. The global reduction of mining production sustained the rapid recovery of precious metal prices after the speculative sell-off mid-March.
Operating margins are not at risk, but production dwindling of course impacts free cash-flow. Mining investors have been quick to sell the rally.
No comments:
Post a Comment